D1 Servo Drive User Manual Tuning
HIWIN MIKROSYSTEM CORP. 6-27
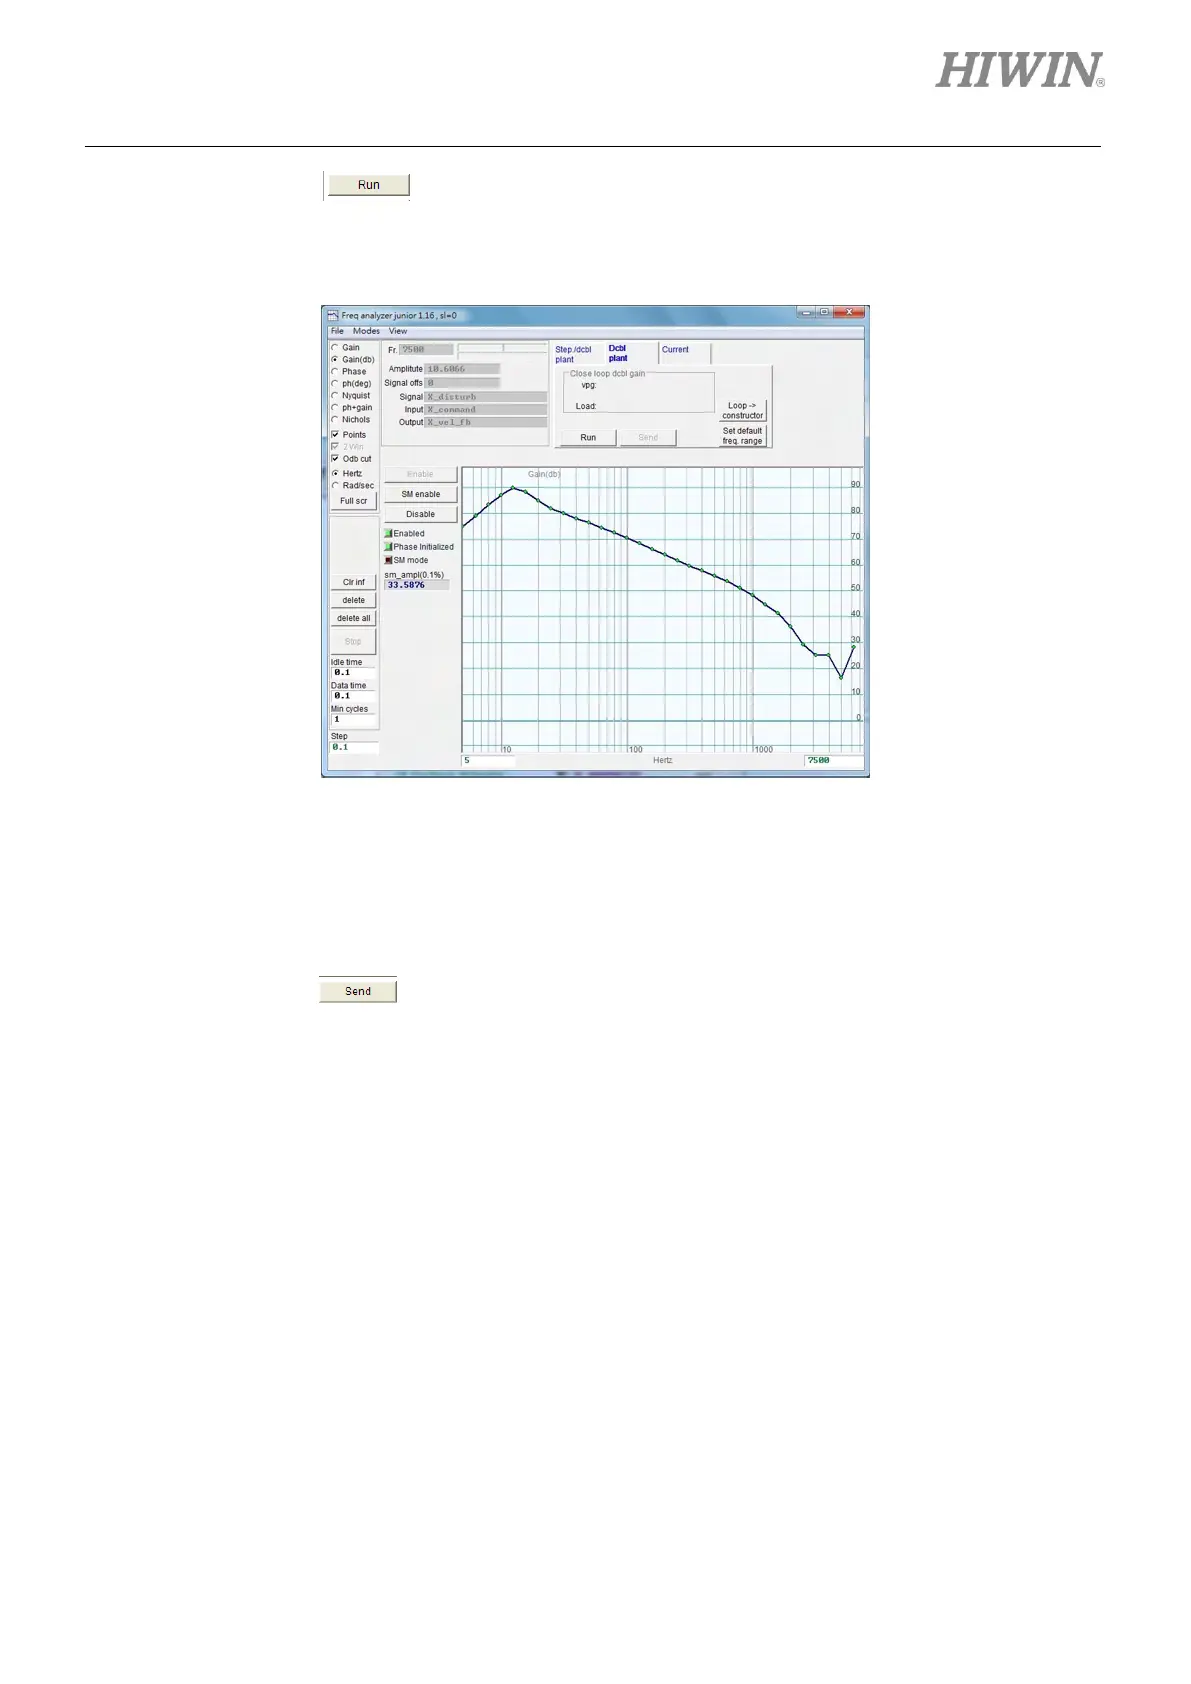
Step 3: Click on to start frequency analysis. Motor will firstly vibrate at low frequency
and then generate a high-frequency sound. A frequency response graph will appear as
figure 6.6.3.3 after completion.
Figure6.6.3.3
Step 4: Left click on the graph to show a reference line (-20dB). Move the reference line to the
frequency response line, as figure 6.6.3.4. The gain will be recalculated and updated in the
field of vpg. The gain is increased when the reference line is moved downward. The gain is
decreased when the reference line is moved upward.
Step 5: Click on to send velocity loop gain to the servo drive. If users would like the gain
to be accessible after power off, please save it to the servo drive Flash.