Pathway Technical Reference Manual
Proprietary 122 of 190
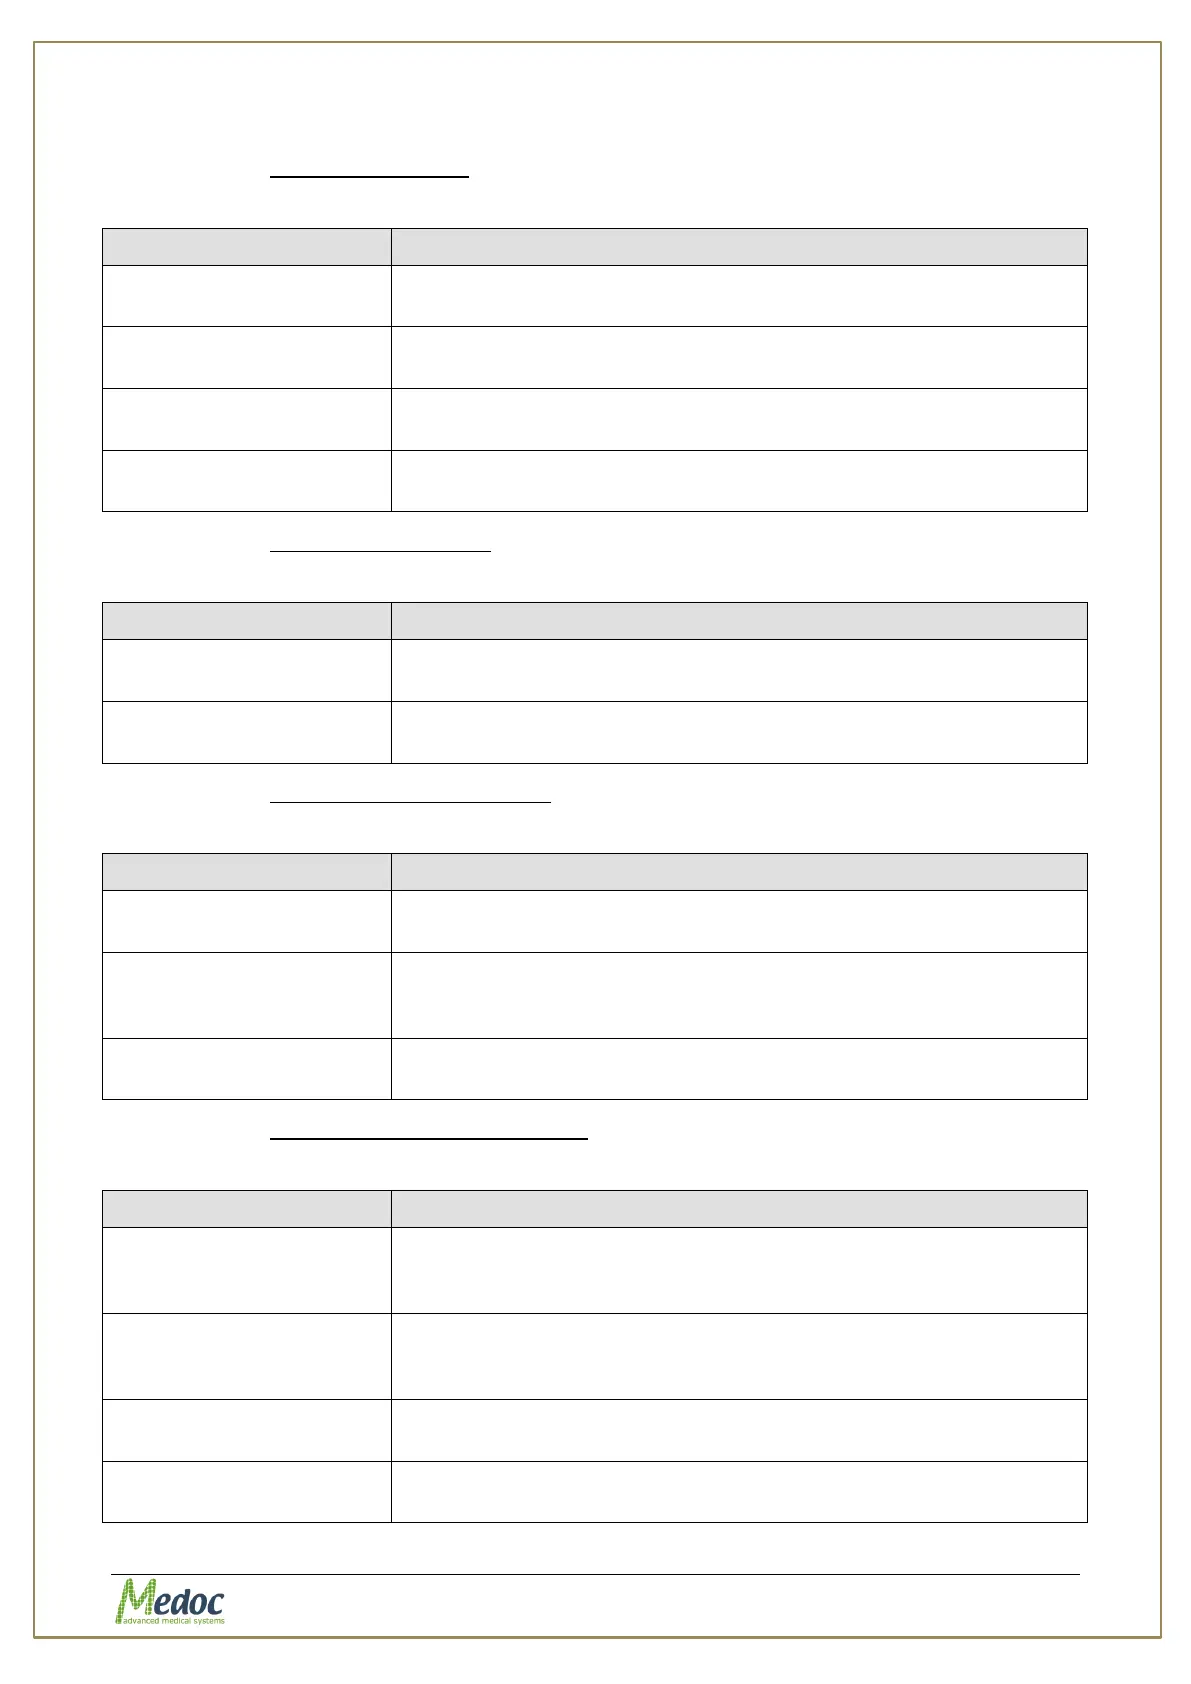
The following options are available:
10.3.1.1 Pre-test settings
Table 27: Pre-test parameters
The bottom margin for a stabilized temperature allowed for a
successful pre-test.
The top margin for a stabilized temperature allowed for a
successful pre-test.
The stabilized temperature duration, required to render a
successful pre-test.
The maximal time allowed for stabilizing trials (during the pre-test
sequence).
10.3.1.2 Test Configuration
Table 28: Test configuration parameters
The bottom margin, above which the system declares that it has
ascended a high destination temperature.
The top margin, below which the system declares that it has
descended to a low destination.
10.3.1.3 Post Test Configuration
Table 29: Post-test parameters
Post-test temperature stabilization is required by safety
standards. This setup is used to add time for post-test monitoring.
When the Add Comments option is checked, a dialog box for
adding comments to the test open when a test ends. These
comments will be displayed in the final report.
When Save Automatically option is checked, results will be saved
automatically at the end of each test.
10.3.1.4 Test Display Configuration
Table 30: Test Display configuration
When checked, the COVAS output graph is displayed, with the
stimulation output graph by default. Can also be changed per test,
from the Test View screen.
When checked, the Normative Data information graph is
displayed, with the stimulation output graph by default. Can also
be changed per test, from the Test View screen.
Sets the trial scale of the output graph while using the Limits
method. Can also be changed per test, in any Test View screen.
Sets the time scale of the output graph. Can also be changed per
test, in any Test View screen.