Pathway Technical Reference Manual
Proprietary 64 of 190
Do NOT immerse the Thermode in any kind of liquid.
6.4.2 Temperature Graph Display
During the test, the test graph is generated and displayed on the screen. Following is an
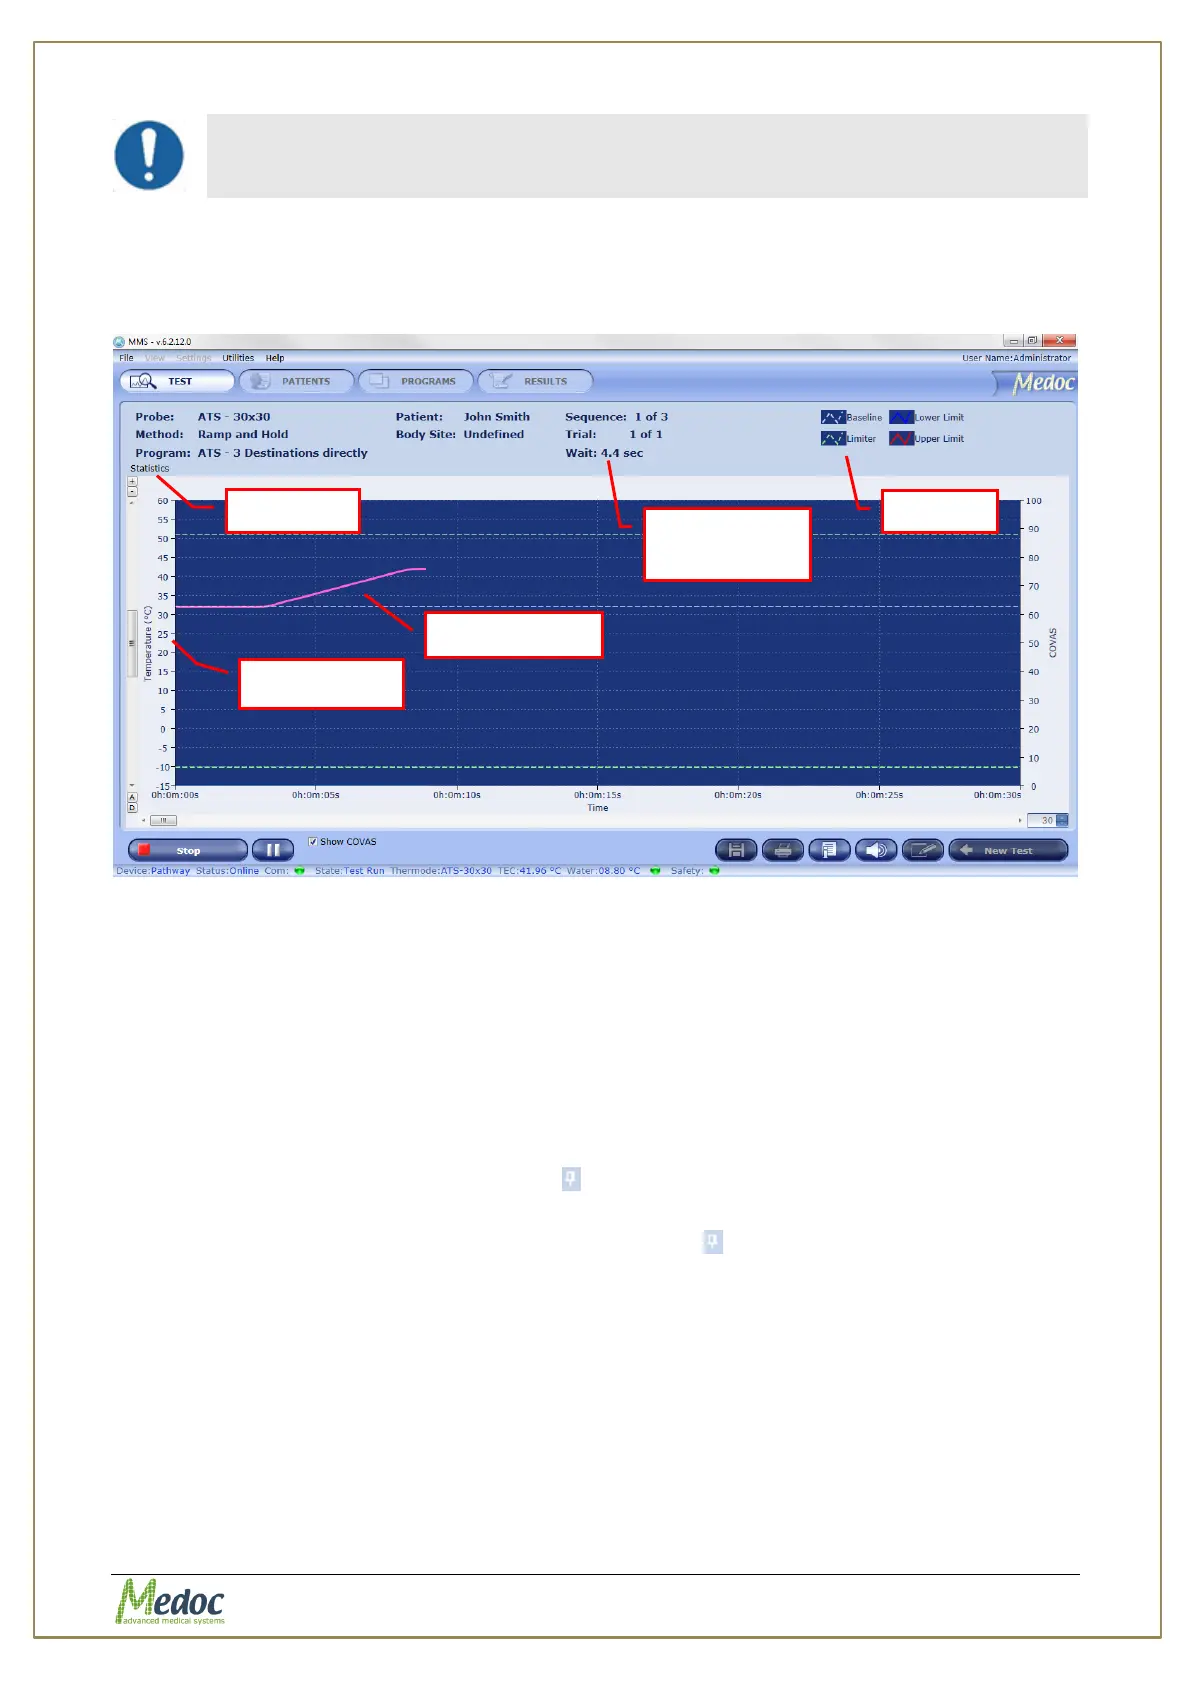
example:
Figure 30: Real-Time Test
The following information is displayed:
Stimuli display (including CoVAS and events where applicable)
Current probe and program details.
Current sequence and trial data
Legend
Axes labels: Temperature axis on the left and CoVAS on the right (where applicable)
Statistics Panel: hidden by default. To view in full click on it. To keep the display
permanently open, use the pin icon ( ) on the top right corner. Click again to hide.
Test and Patient Details Panel: hidden by default. To view in full click on it. To keep
the display permanently open, use the pin icon ( ) on the top right corner. Click
again to hide.