Signal Integrity Conditioning
Microsemi Proprietary and Confidential UG0677 User Guide Revision 9.0 118
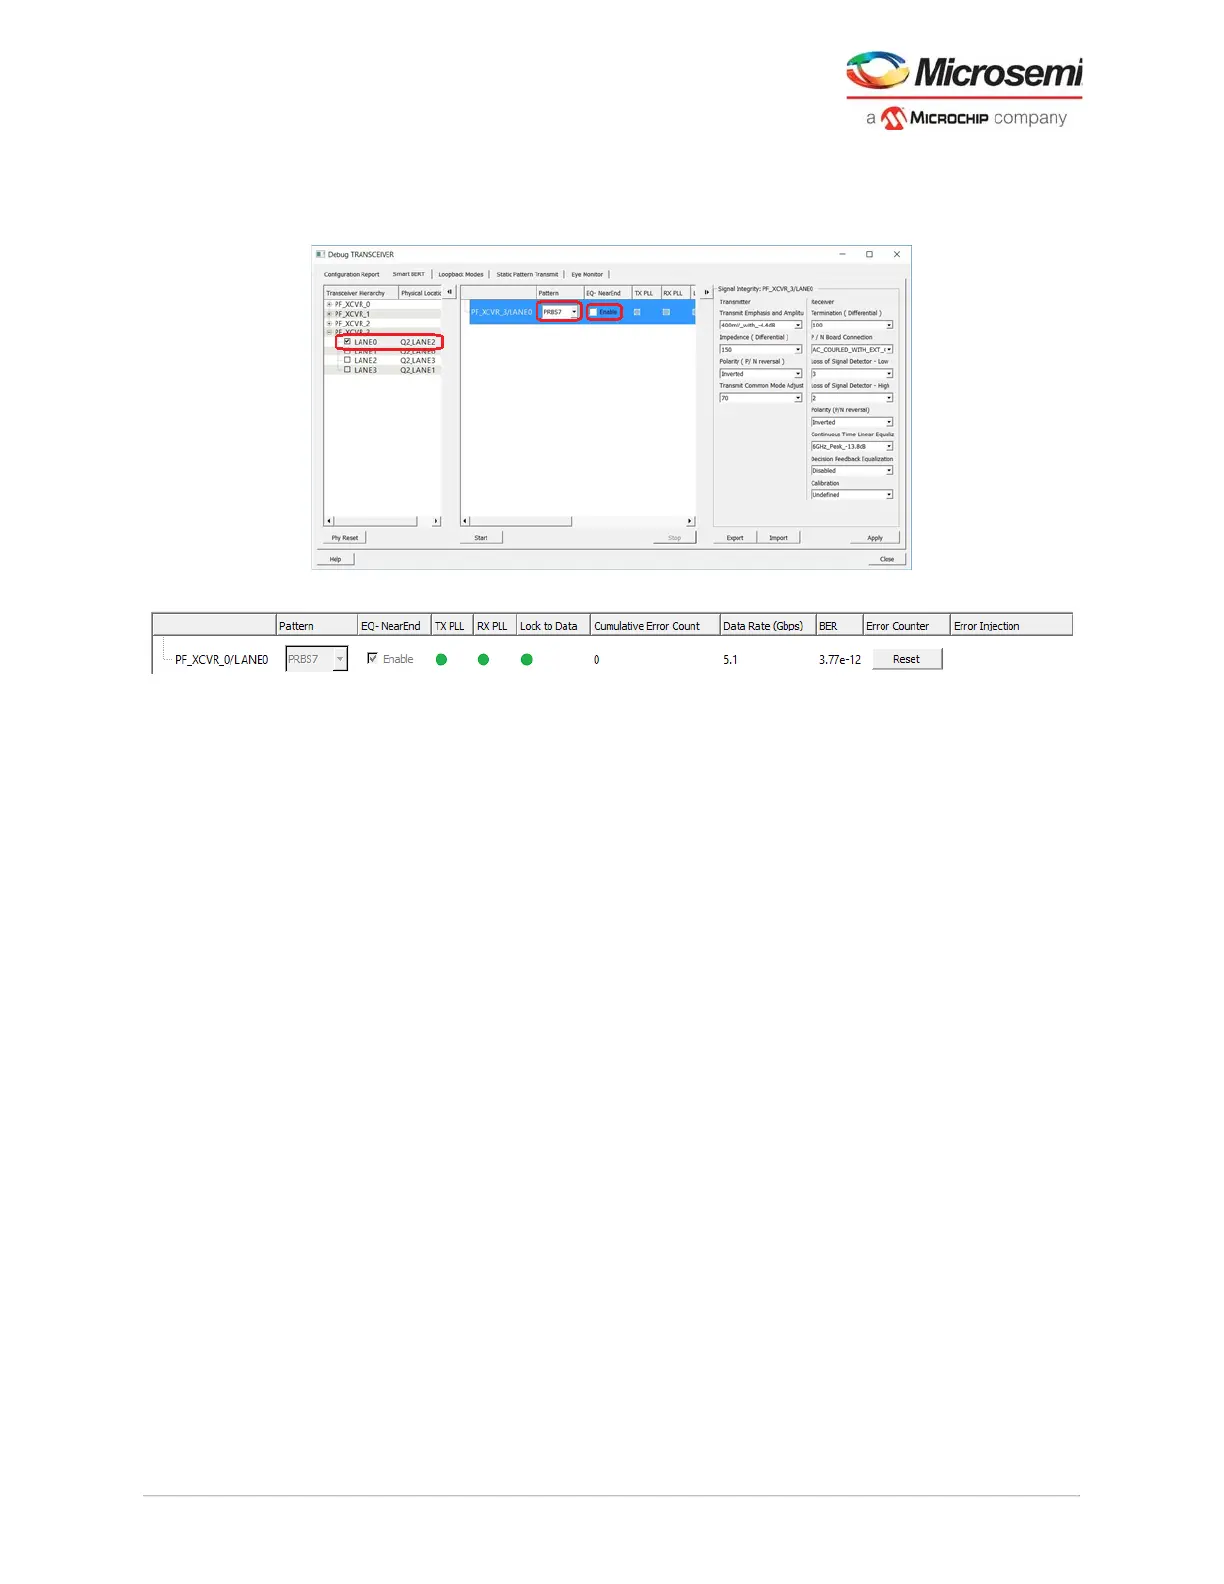
Monitor the Lock indicators and error counters to check the quality of the link. This test ensures proper
power supplies, clocks and resets to the XCVR and traffic is not going off-chip to the system. The
following figures show the Smart BERT options of the debug transceiver.
Figure 95 • PRBS Self Test Near-End Loopback Example
Figure 96 • Test Status Indicators
5.4.3 Eye Monitoring
Eye monitor enables visualizing the eye diagram present within the receiver. This feature plots the
receive eye after the CTLE and DFE functions. The diagram representation provides vertical and
horizontal measurements of the eye and BER performance measurements (see Figure 97, page 119).
Eye Monitor is supported for data rates above 3.125 Gbps.
It is unfeasible to physically measure the eye opening at the XCVR receiver with an oscilloscope.
Typically, the closest probe point is at the receiver device package pin at the PCB interconnection. This
probe point does not provide the accuracy required to measure the real eye-width at the data sampling
point since this point is before any input equalization can properly condition the signal.
On-chip eye monitoring circuitry provides a mechanism to measure and visualize the receiver eye margin
after the equalizer, that enables access to eye quality measurements. The eye monitor is included in
every transceiver design not requiring any other user added RTL blocks. The eye monitor functionality is
based on capturing data sample in the nominal center and offset of the receiver eye. The eye monitor
assists to estimate the horizontal eye-opening and select the best data sampling point at the receiver.
The eye monitor feature provides 32 phase steps spanning one complete UI. The eye monitor algorithm
steps through 32 phase steps while monitoring the BER at each phase step capturing the horizontal eye
opening after receiver equalization.
5.4.3.1 SmartDebug Eye Monitor Utility
The eye information of an individual transceiver lane is available in the SmartDebug Eye Monitor utility
and is used to view the eye opening after the signal conditioning of the receiver equalization. After the
receive buffer, graphically plots the eye opening to visualize the signal quality, Eye Monitor utility within
SmartDebug uses the on-chip Eye Monitor circuitry, to analyze the incoming data that includes the
receivers gain, noise level, and jitter. The eye monitor is invoked from the eye monitor tab. It requires live
data traffic to be driven into the receiver and cannot be used with the on-chip loopback paths.
The generated eye plot depicts one unit interval (UI) or one bit-period centered on the x and y axis. The
y-axis shows the vertical opening with respect to voltage. Its upper and lower bounds are limited by the
capture. In the y-axis, the plot shows the signal clipped on the top and bottom. This is an operation of the
algorithm and not actually the quality of the input signal. The x-axis depicts the phase steps across one
UI.