Signal Integrity Conditioning
Microsemi Proprietary and Confidential UG0677 User Guide Revision 9.0 119
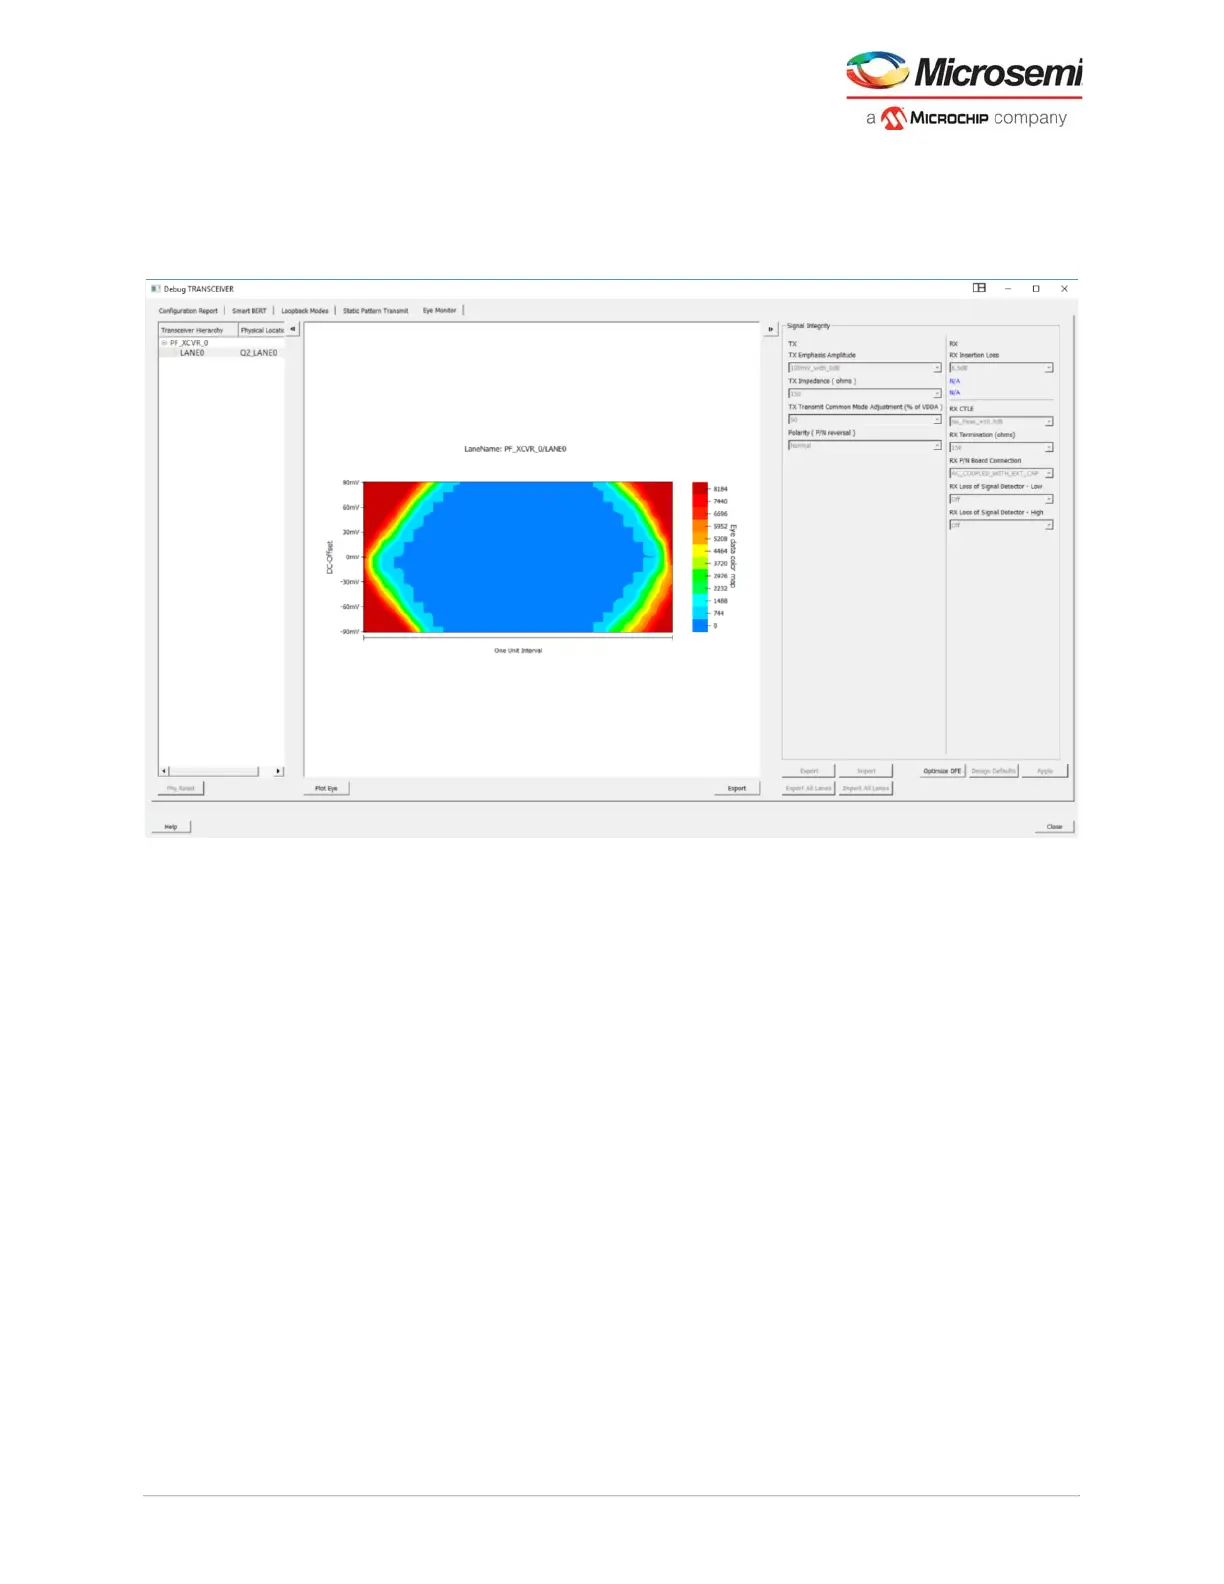
The plot produces an eye diagram by overlaying many bits whereas a color gradient shows the density
hits of the signal. Thus, the opening is represented as the area with least hits.
Click the Eye Monitor tab in the Debug TRANSCEIVER window to see the eye monitor representation
within the receiver.
Figure 97 • Eye Monitor Plot