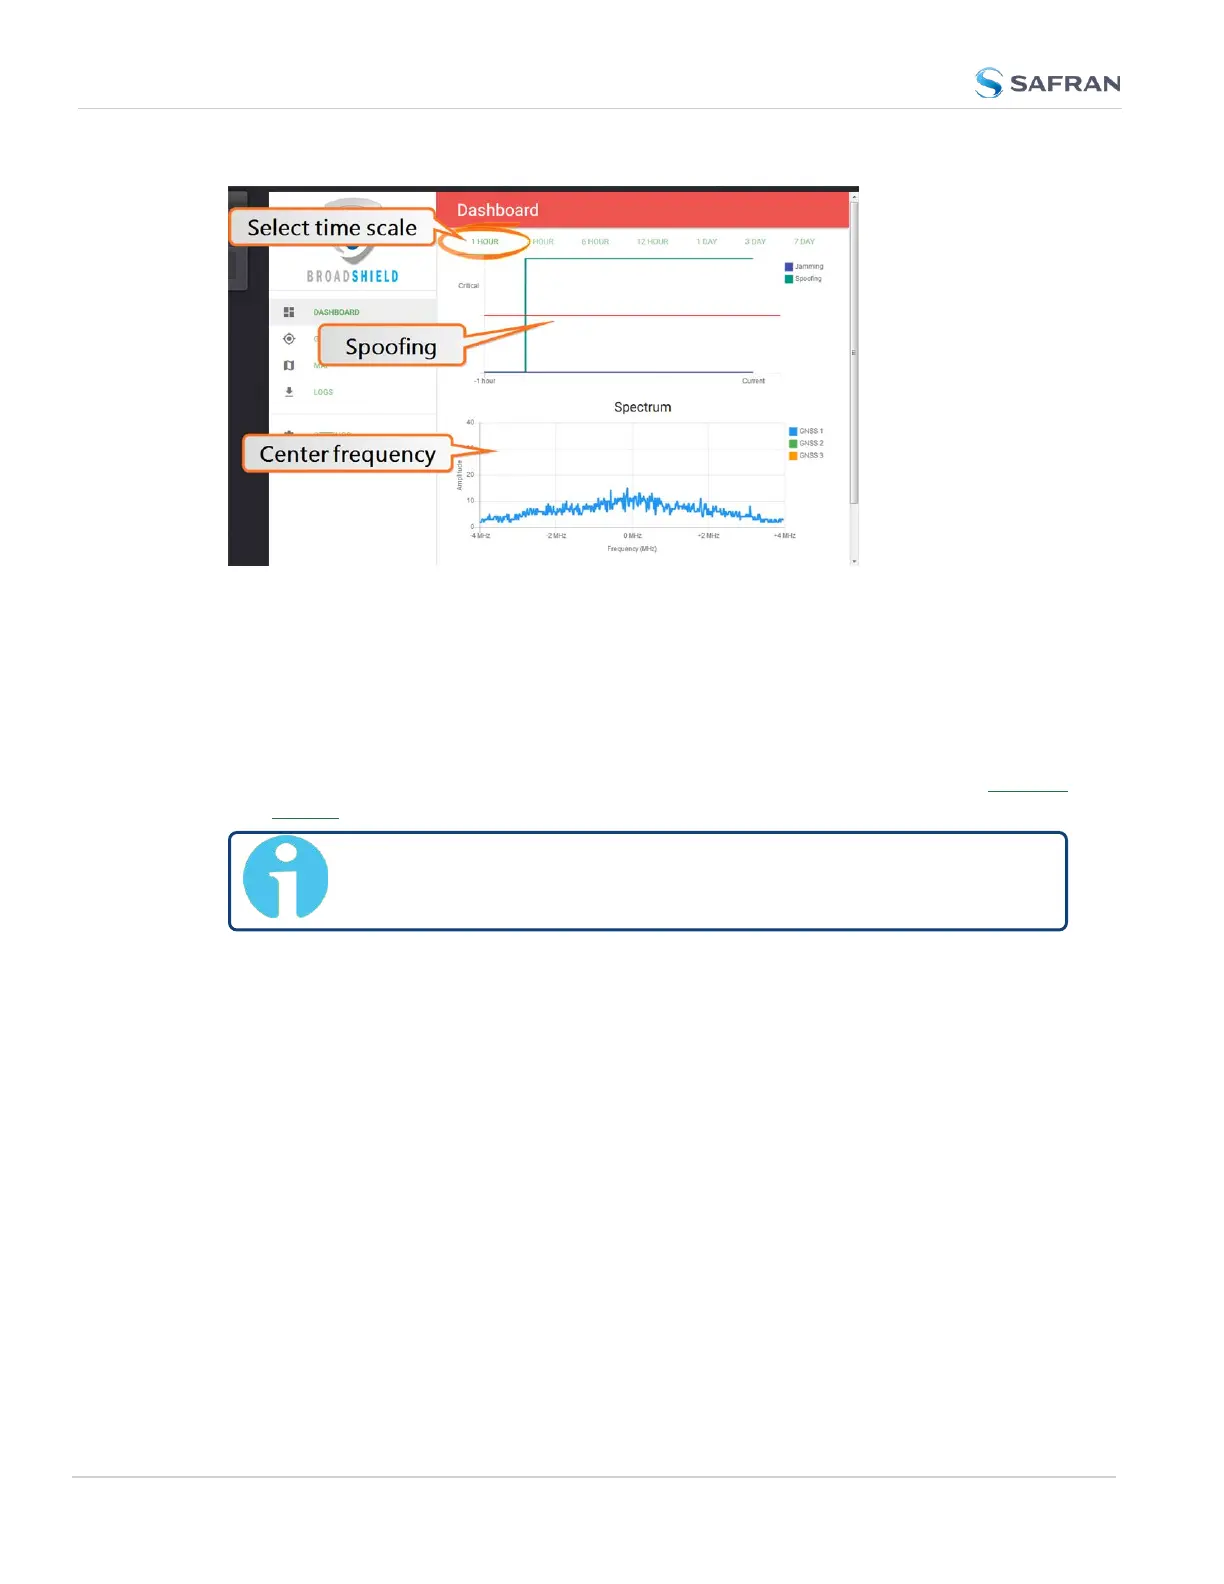
Top graph
The Dashboard top graph displays the past signal level over time, divided into a
Normal and a Critical signal level (separated by a red line). A blue line in the Crit-
ical zone indicates a potential jamming incident, while a green line indicates that
VersaSync may be subject to a spoofing attack.
You can change the time scale by clicking on any of the labels between 1 HOUR
and 7DAY.
Note: A VersaSync reboot will reset all history data (it can still be
retrieved via LOGS.)
Bottom graph
The bottom graph labeled Spectrum visualizes the current signal over the GPS
frequency band. Unusual amplitude spikes indicate a potential threat. If your sys-
tem is equipped with more than one GNSSreceivers, a green and an orange
graph will indicate the signal level for additional receivers.
GNSS 1 Status
190
CHAPTER 3 • VersaSync User Manual Rev. 12
3.3 Managing References