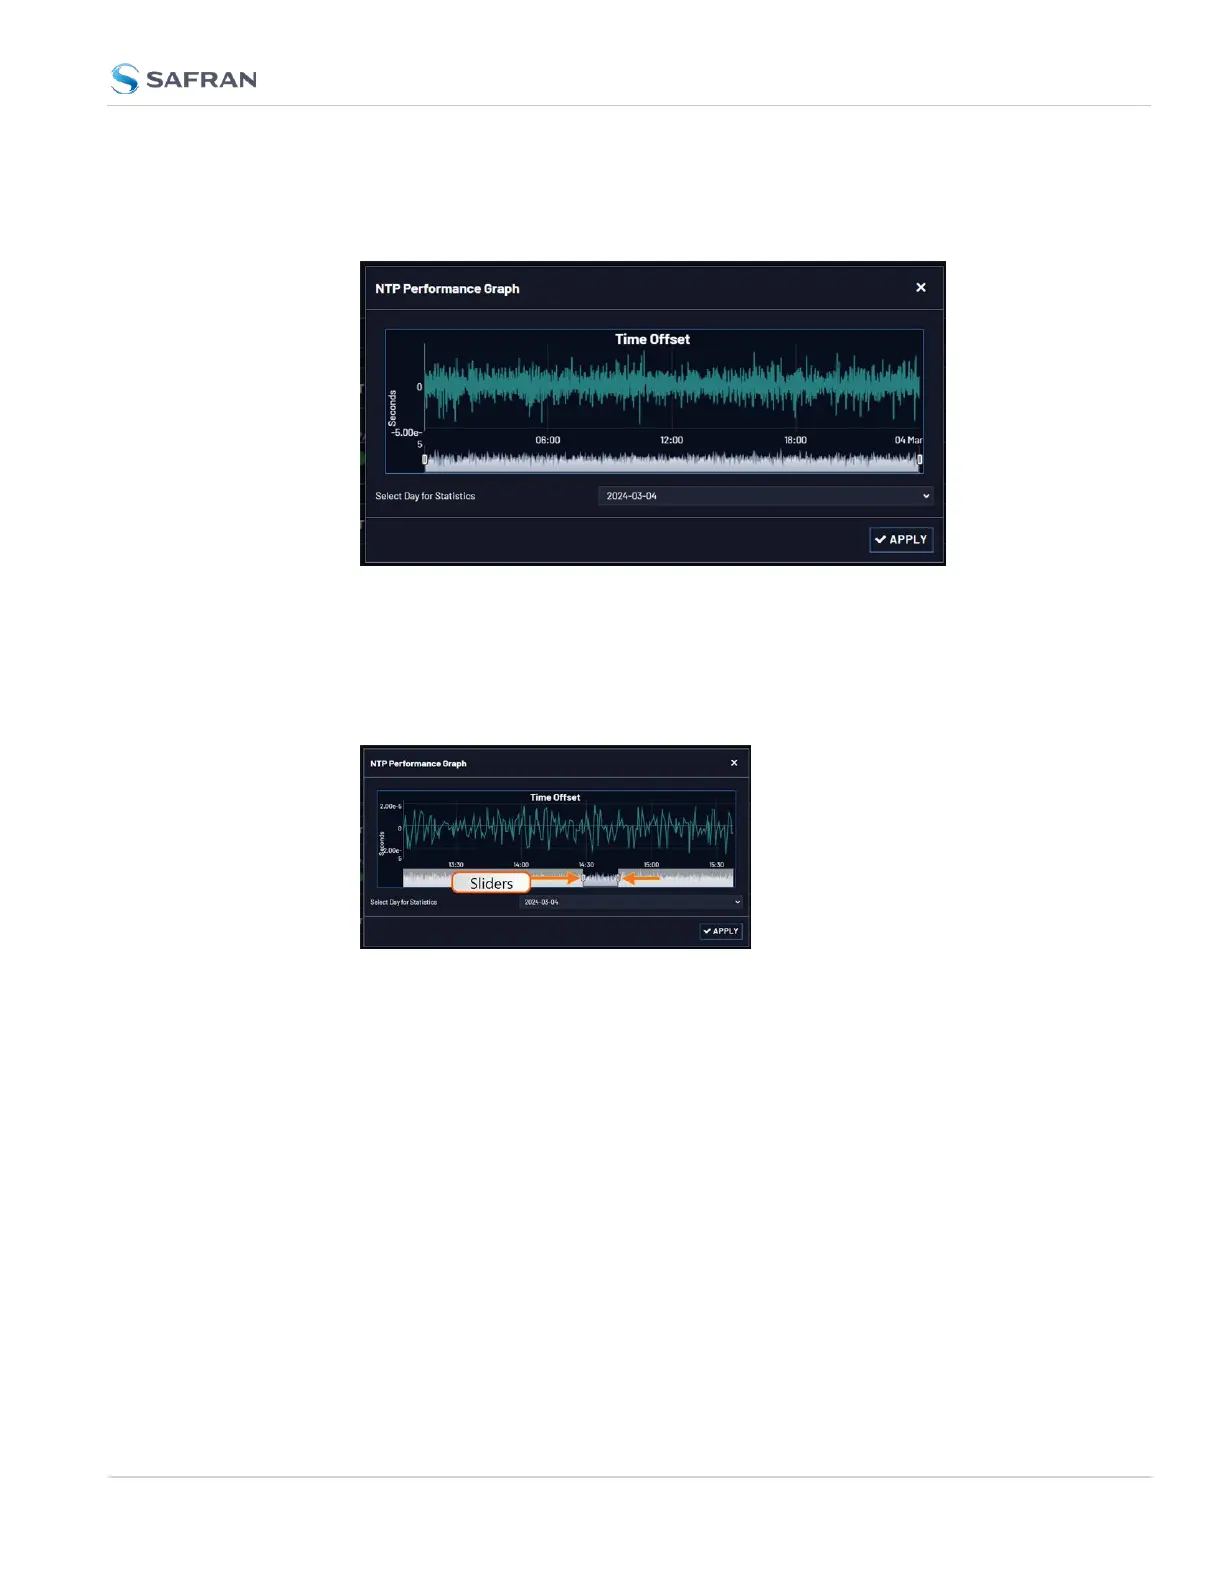
3. Click the graph in the NTP Status Summary panel.
4. The NTP Performance Graph panel will appear.
5. To select the statistics for a particular day, select a date from the drop-
down list in the Select Day for Statistics field. The default date is the
present date. Click Apply.
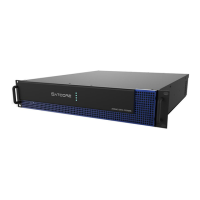
6. To display a higher resolution graph for a shorter time span, move one or
both time sliders at the bottom of the graph inwards.
The NTP Frequency Offset Performance Graph
To view the NTP Frequency Offset performance graph:
1. Navigate to MANAGEMENT > NETWORK: NTP Setup.
2. In the NTP Status Summary panel locate the Frequency Offset graph.
4.6 Quality Management
CHAPTER 4 • VersaSync User Manual Rev. 12
277