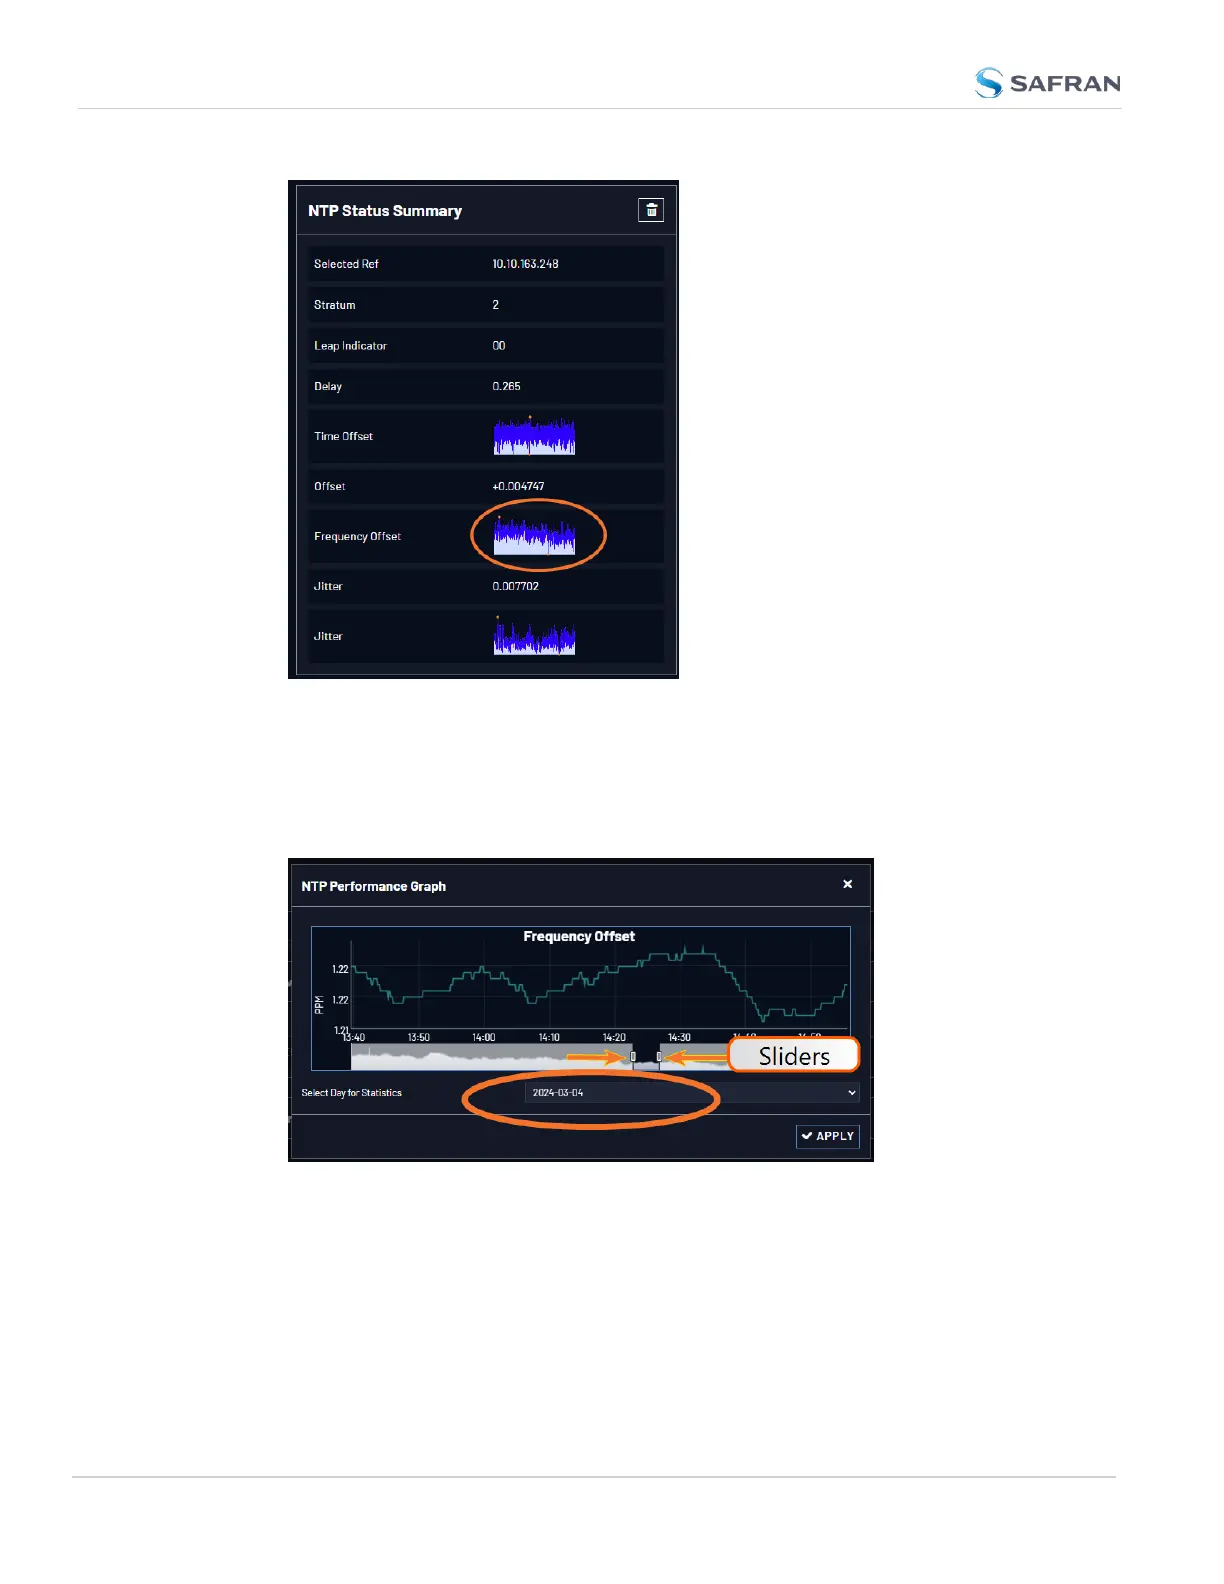
3. Click the graph in the NTP Status Summary panel.
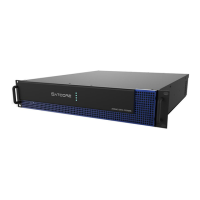
4. The NTP Performance Graph panel will appear (the data may be displayed
with a delay). The X-axis represents time, the Y-axis shows the frequency
offset in parts-per-million (PPM); e.g. 290PPM is equivalent to
.0290percent.
5. To select the statistics for a particular day, select a date from the drop-
down list in the Select Day for Statistics field (highlighted in green in the
illustration above). The default date is the present date. Click the Apply but-
ton.
278
CHAPTER 4 • VersaSync User Manual Rev. 12
4.6 Quality Management