2.
(Optional) Tap the dropdown list then select the view for the plot.
•
Linear
•
Log 10
3.
(Optional) Tap Actions4Analyze amp plots.
4.
(Optional) Tap Actions4View well details to see the amplification for a specific well.
5.
Swipe right twice or tap the left arrow (
) twice to return to the home screen.
Adjust the display of real-time plots during a run
1.
In the r
eal-time amplification plot, tap
(Zoom) or pinch.
2.
T
ap the arrows to pan left or right, or swipe left or right within the amplification plot.
View the time remaining during a run
1.
In the home screen during a run, swipe left three times or tap the right arrow (
) three times.
The time r
emaining in the run is displayed.
2.
Swipe right three times or tap the left arrow (
) three times to return to the home screen.
L
ock the touchscreen during a run
After you have started a run, you can lock the touchscreen so that other users cannot interfere with
instrument operation.
Note: You must be signed in.
1.
In the home scr
een during a run, tap
(P
rofile).
2.
Tap Lock screen4Lock.
The status dial displays Locked.
The touchscreen automatically unlocks when the run is complete.
The touchscreen can be unlocked during the run (see “Unlock the touchscreen during a run” on
page 75).
Chapter 5 Options for a run
V
iew the time remaining during a run
5
74
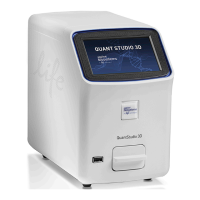
QuantStudio
™
6 Pro Real-Time PCR System and QuantStudio
™
7 Pro Real-Time PCR System User Guide