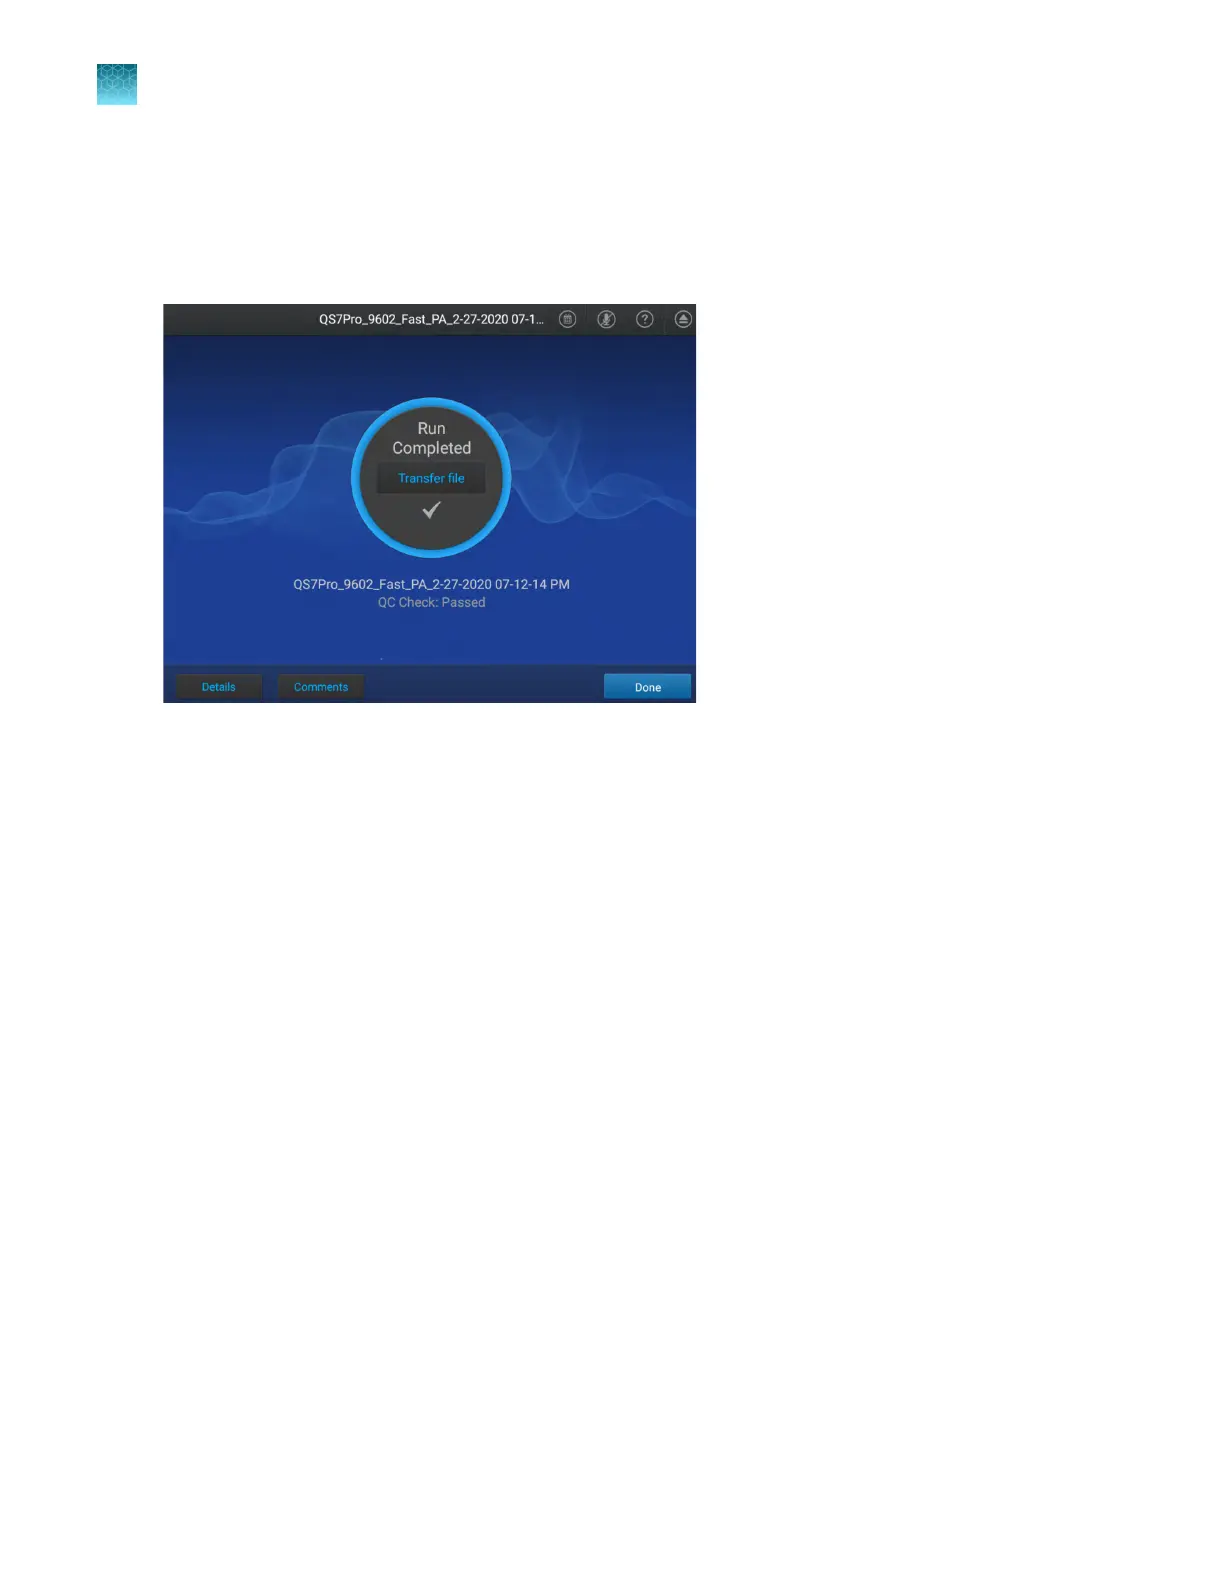
View an amplification plot after a run
The status dial displays Run complete when a run is complete. The amplification plot can only be
viewed immediately after a run. After Done is tapped, the amplification plot can no longer be viewed on
the instrument.
If the automatic sign-out feature is enabled and the set time has elapsed, the instrument will display the
Sign In scr
een. The amplification plot cannot be viewed on the instrument after the run.
1.
In the home screen after a run is complete, tap Details.
The amplification plot is displayed. The display can be adjusted (see “Adjust the display of real-
time plots during a run” on page 74).
2.
(Optional) On the Details screen, tap the Plot Types dropdown list, then select a plot type.
•
Rn vs. Cycle
•
dRn vs. Cycle
3.
(Optional) On the Details screen, tap the Y-Scales dropdown list, then select the view for the plot.
•
Linear
•
Log 10
4.
(Optional) Tap Well details, then tap Samples or Targets.
5.
Select an amplification plot preview, then tap View amp plot.
6.
(Optional) Tap a specific well on the right side of the amplification plot to see the details for the
single well.
7.
Tap Close to return to the home screen.
Chapter 6 V
iew and manage files
Manage data files
6
80
QuantStudio
™
6 Pro Real-Time PCR System and QuantStudio
™
7 Pro Real-Time PCR System User Guide