3.
Examine the raw data to identify the wells yielding signals according to the ranges shown in the
following table.
Plate type Acceptable signal range
[1]
96-well 800,000 to 3,200,000
384-well 400,000 to 2,000,000
[1]
S
ignal range for the optical filter where the dye is brightest.
4.
Examine the raw data to identify the wells yielding signals in the acceptable range for the optical
filter where the dye is brightest.
5.
(Optional) Export the raw data, then calculate the average fluorescence value for each
concentration.
6.
Select the lowest optimal dye concentration that falls within the acceptable signal range.
Calibrate the custom dye
Create a custom dye calibration plate
IMPORTANT! W
ear powder-free gloves while creating the dye plate.
Create a full plate of the custom dye diluted to the optimal concentration:
1.
Dilut
e the custom dye to the optimal concentration in buer.
Prepare an adequate volume, using a volume range of 10–20 µL/well for a 96‑well plate.
2.
Pipet the appropriate volume of the diluted custom dye to the plate wells.
3.
Seal the plate.
4.
Vortex the plate for 5 seconds, then centrifuge at 750–1,000 × g for 2 minutes.
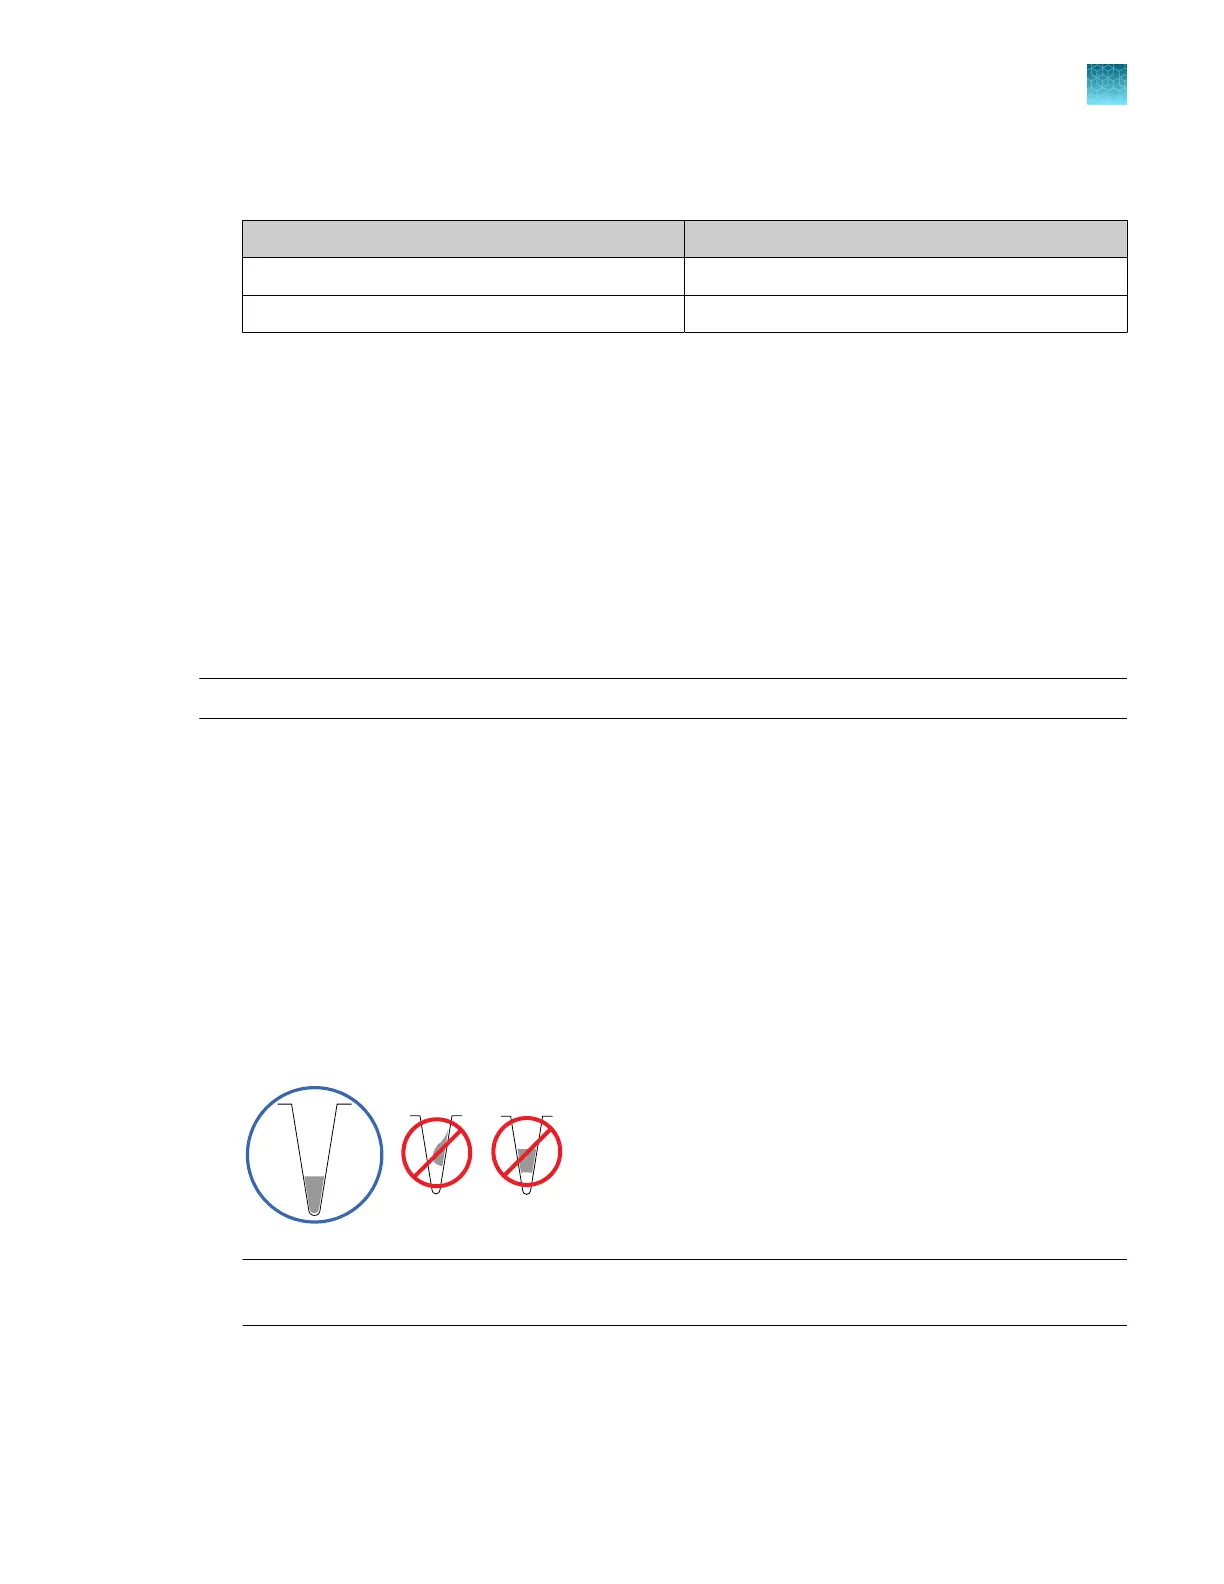
5.
Confirm that the liquid in each well is at the bottom of the well and free of bubbles. If it is not,
centrifuge the plate again.
IMPORTANT! K
eep the bottom of the plate clean. Fluids and other contaminants on the bottom
of the plate can contaminate the sample block and cause an abnormally high background signal.
Chapter 7 Calibrate and verify instrument performance
Calibrate custom dyes
7
QuantStudio
™
6 Pro Real-Time PCR System and QuantStudio
™
7 Pro Real-Time PCR System User Guide
117