183
Smart Camera / Vision-Sensor / 1D-/2D-Code-Scanner / OCR Reader
11.25.3. Configuration
Under channel count, the statistic module includes the configuration, which depends on the number of chan-
nels to be observed:
• Channel #1
11.25.3.1. Channel # 1
Objective
A certain value can be analyzed.
Property
The following settings/results are displayed:
Minimum The lowest value of the most recently observed measured
value results is indicated.
Maximum The highest value of the most recently observed measured
value results is indicated.
Mean The arithmetic mean value is calculated from the most recently
observed measured value results.
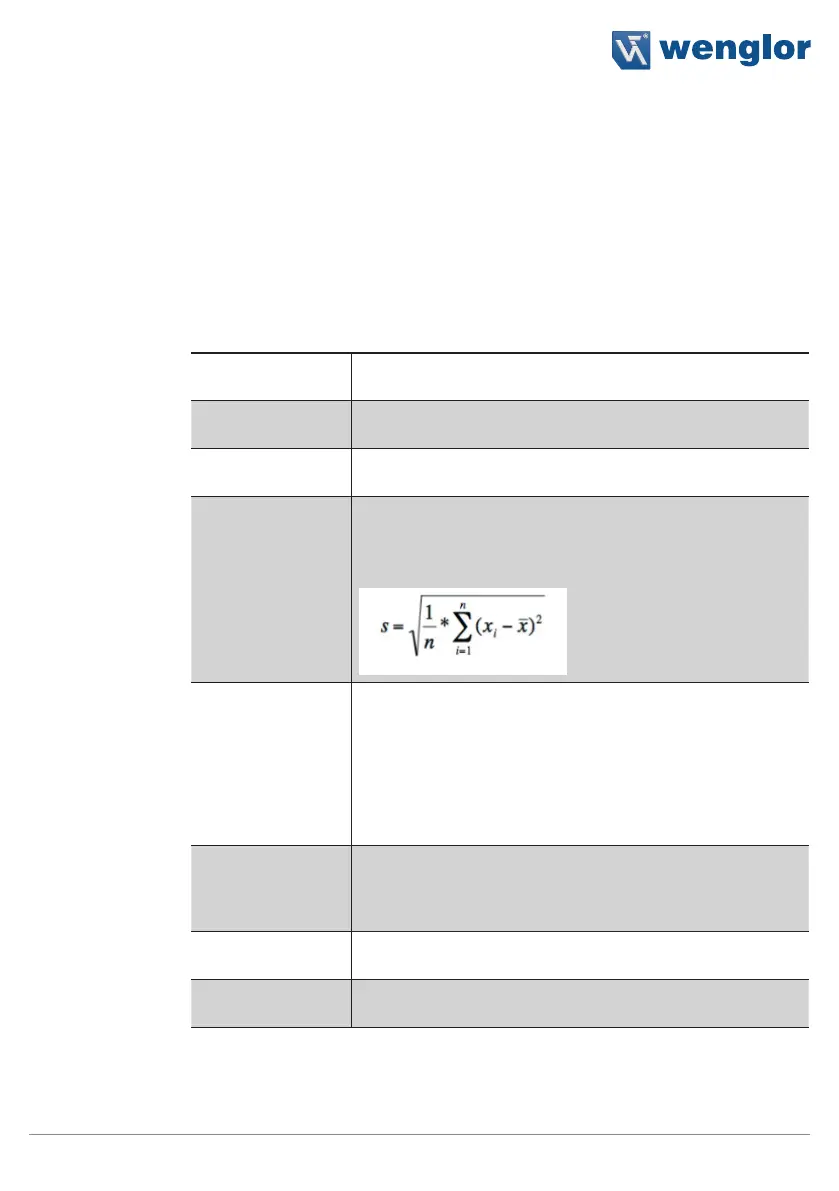
Standard Deviation Standard deviation is determined on the basis of the most re-
cently observed measured value results. Standard deviation is
the square root of the sum of the squared differences from the
mean value divided by the number of values.
Trend All observed measured value results are subdivided into new
and old events by means of the trend ratio. The arithmetic
mean value is determined for the old, as well as for the new
measured values. The difference between these arithmetic
mean values is the trend.
Note: If the trend is close to 0, the measured value has re-
mained relatively constant during the observation time period.
Good The most recently observed measured value results are used
to determine how often the measured value is within the speci-
fied tolerance. The good portion is indicated as a percentage
of all analyzed values.
Input to Track A variable application result can be linked to statistical evalu-
ation.
Reset Statistic All most recently observed measured value results, listed un-
der result values, are deleted.