59
Smart Camera / Vision-Sensor / 1D-/2D-Code-Scanner / OCR Reader
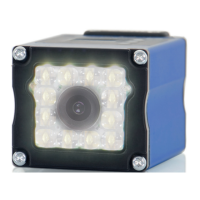
10.2.3.3. Profile
The profile area indicates the gray-scale values along an arrow within the image area. The gray-scale value for
entirely black objects is 0, and for entirely white objects it’s 255.
An arrow can be defined in the region of interest for the profile area. It’s length and direction can be freely se-
lected. The length of the arrow is depicted in the profile area along the X-axis. A gray-scale value within a range
of 0 to 255 is assigned to each point within the arrow along the Y-axis, where 0 corresponds to black and 255
to white. This support system simplifies the processing of transitions.
Note: With threshold analysis, the gray-scale values at both sides of edges can be analyzed with the help of the
profile area, making it easier to adapt entry of the threshold values (see sections 11.7 and 11.8)
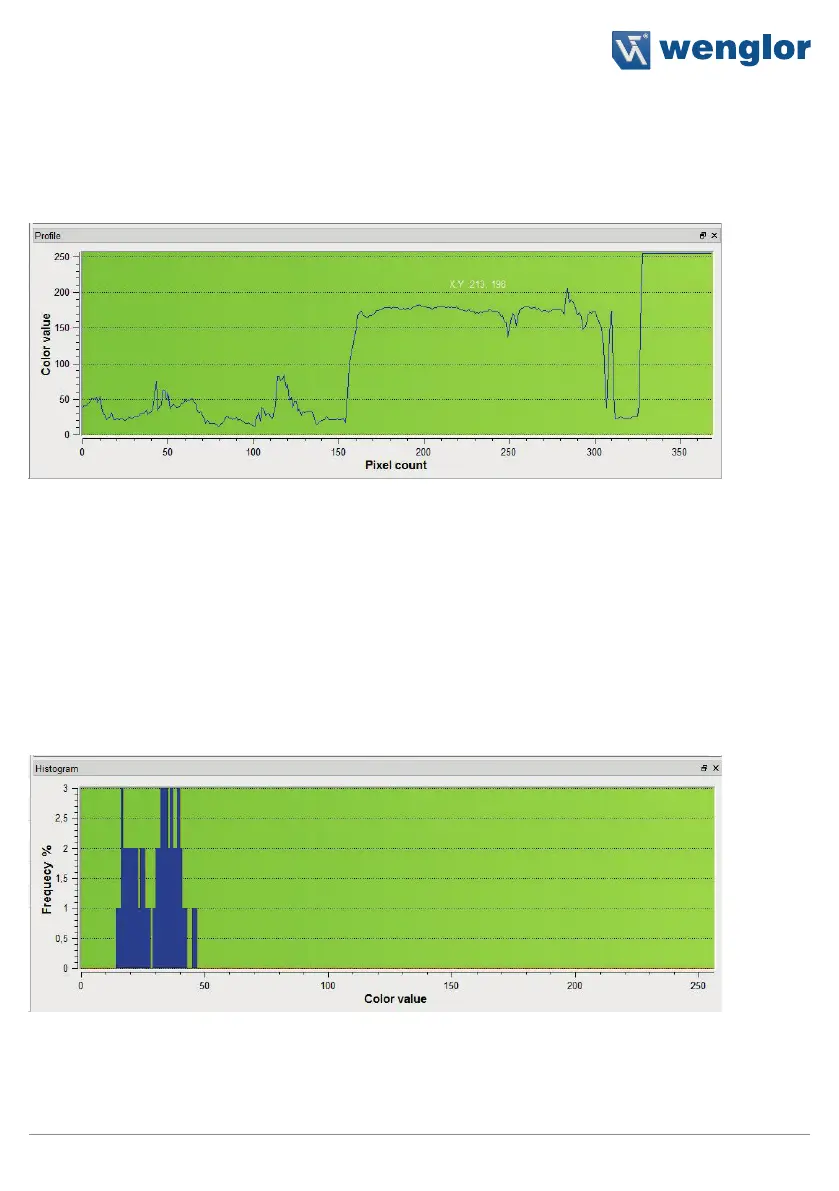
10.2.3.4. Histogram
The histogram area indicates frequency distribution of the gray-scale values of a given surface in the region of
interest.
Similar to the profile area, the area to be examined must first be specified in the region of interest. This is a rect-
angle in the case of the histogram, whose size and position can be changed as desired. All gray-scale values
from 0 to 255 appear along the X-axis. Along the Y-axis, a frequency value is assigned to each gray-scale value
for the selected area. And thus the number on the Y-axis indicates the number of pixels for the corresponding
gray-scale value.