ZoomZoom
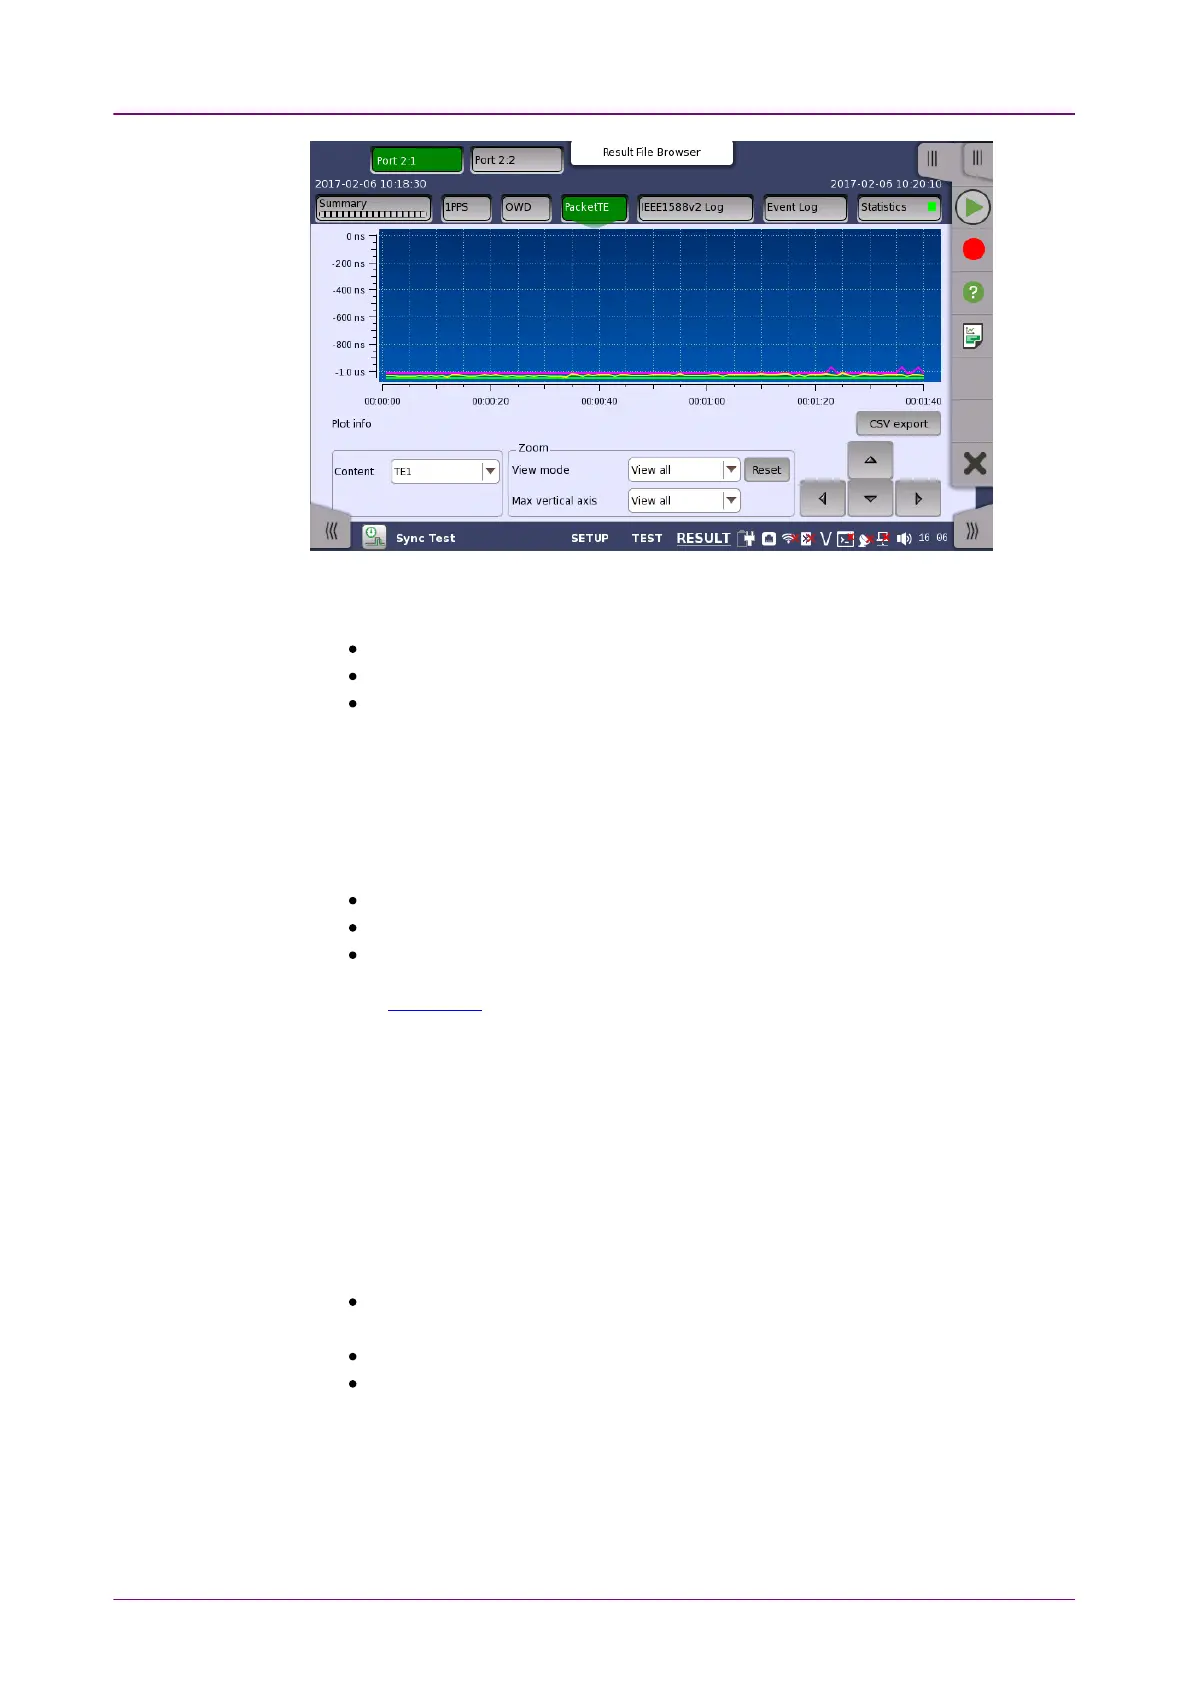
In this screen, the one way delay test results are displayed as a graph, showing
the positions of a time error over time.
Pink line shows maximum time error values during one second.
Yellow line shows average time error values during one second.
Light green line shows minimum time error values during one second.
CSV exportCSV export
Outputs measurement results in CSV format.
ContentContent
Select the contents corresponding to the test to display.
TE1TE1: Mean value of TE1
TE4TE4: Mean value of TE4
TerrTerr: Time error between DUT and Network Master
Refer to Packet TE in Summary.
To zoom in, select a zoom area directly in the graph area by drawing a
rectangle with a finger or the stylus (delivered with the instrument).
When releasing the finger or stylus, the graph area zooms in to show the
selected part of the graph.
To zoom out, use the view settings below the graph.
View modeView mode
Used to set the x-scaling for the graph. The possible settings are:
Last 1000sLast 1000s, Last 100sLast 100s: Shows a sliding graph area with max. width of 1000
second and 1000 second.
View allView all: Shows a graph area with a width as the duration of the test.
CustomCustom: This is automatically selected when the graph area is touch-
manipulated.
Max vertical axisMax vertical axis
Used to set the y-scaling of the view. The maximum amplitude of the plot
always originates from the zero line.