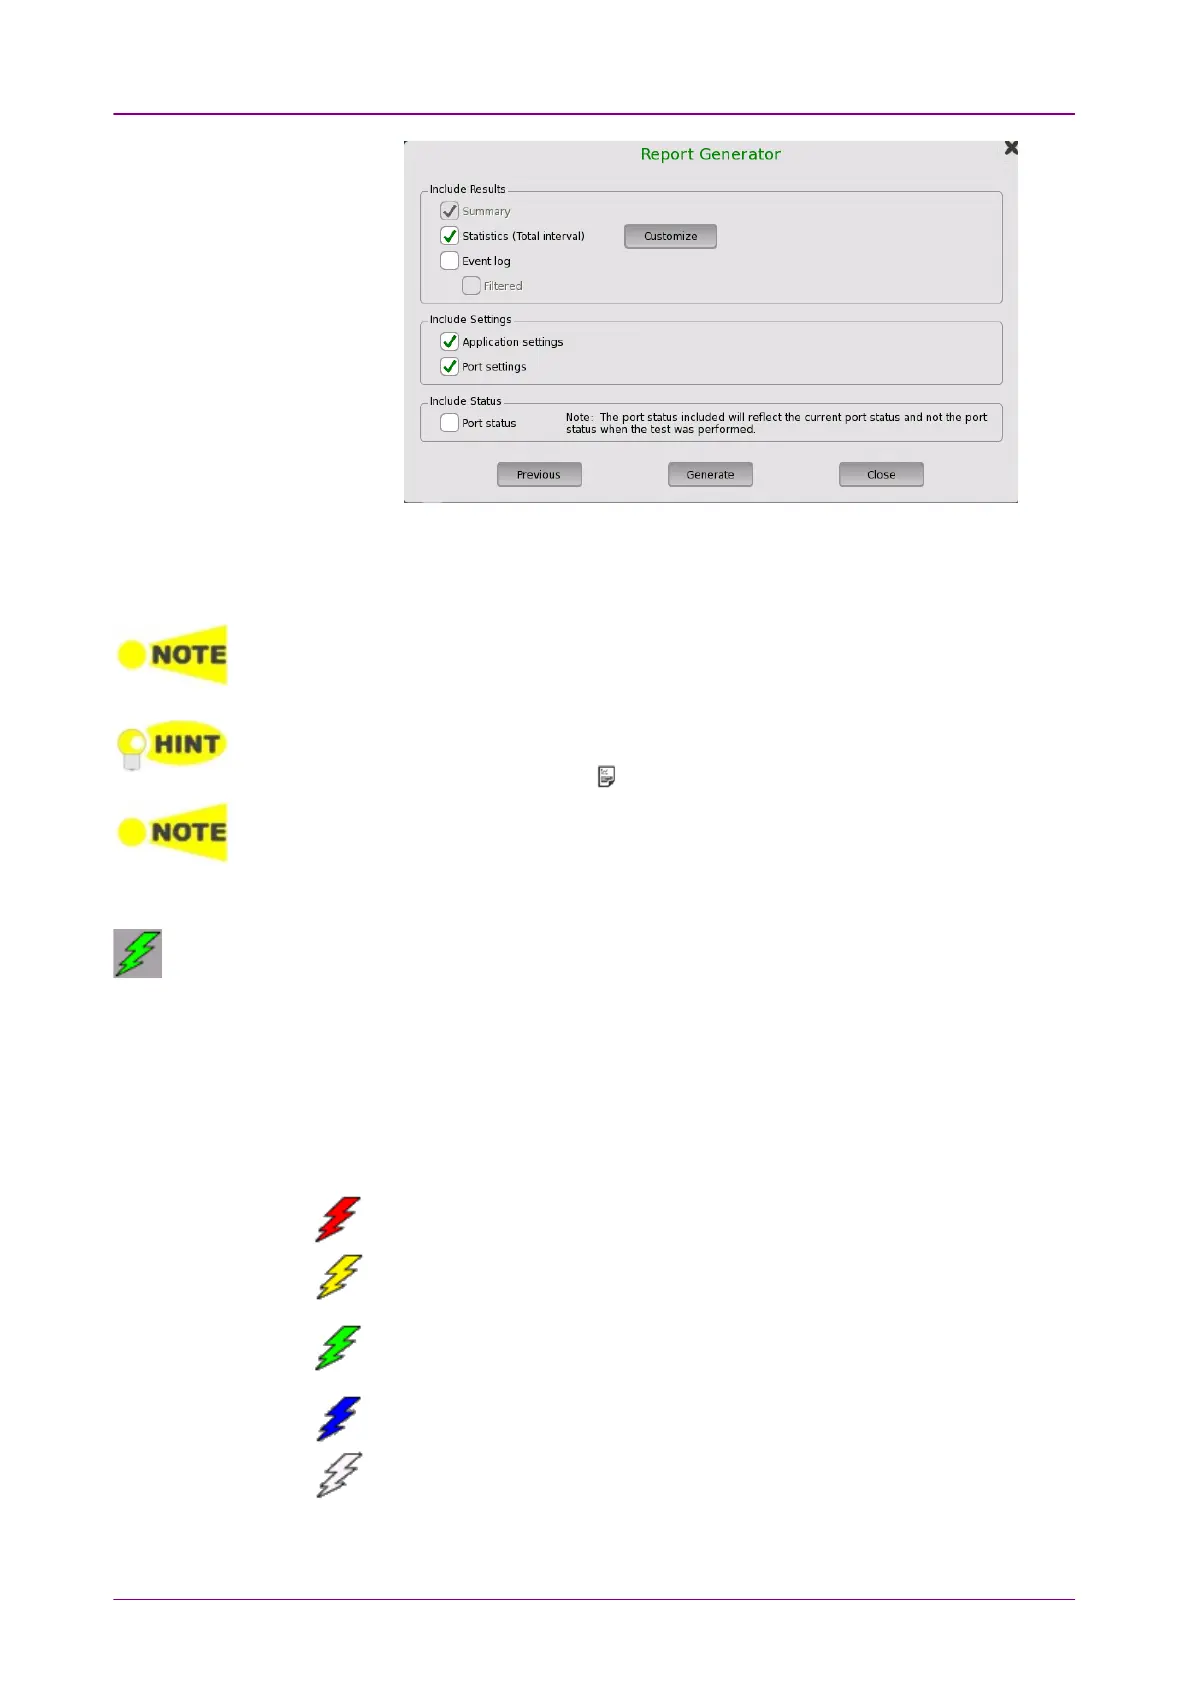
6. Select check boxes of items outputting to the report. Touching CustomizeCustomize
button launches the dialog box selecting items of statistics.
7. Touching GenerateGenerate button starts the report generation.
Adobe® Reader® is recommended as a PDF viewer to open or print out the report.
"Include Performance Verification dates" check box appears in version 3.01 or later.
Creating reports from the Result File Browser will not take up port resources on the
system. From the Result File Browser, select the result file for which you want to create a
report and touch the Report icon ( ).
The Report Generator will remember previous used setup parameters. The first page is
common for all applications while setup parameters on subsequent pages are
remembered on a per application basis.
Alarm/Error InsertAlarm/Error Insert
Touch this icon to activate the stimulus specified in the stimuli setup available in the
expanded
Application toolbar
. Only relevant if the stimulus has been set to manual
insertion. The
stimuli function
is used to generate special or abnormal conditions
during a test.
The color of the icon is coded according to the current level of stimuli inserted.
The different levels are prioritized so that higher levels of stimuli overrule lower
levels. The overall highest stimuli level (see the list below) for all ports
included in the application is reflected.
Red: Alarms are currently being generated.
(highest level)
Yellow: Errors are currently being generated.
Green: No alarms/error are automatically inserted.
Active stimuli require manual insertion by touching the Alarm/Error InsertAlarm/Error Insert
icon.
Blue: Frequency, Pointer, or Payload offset stimulus is currently applied.
(lowest level)
White: All stimulus is disabled.
CloseClose