DRAFT
September 1, 2004 11:38 am, CH_GetStart.fm
Chapter 2 Getting Started
2-30 Applied Biosystems 7900HT Fast Real-Time PCR System and SDS Enterprise Database User Guide
Tabs
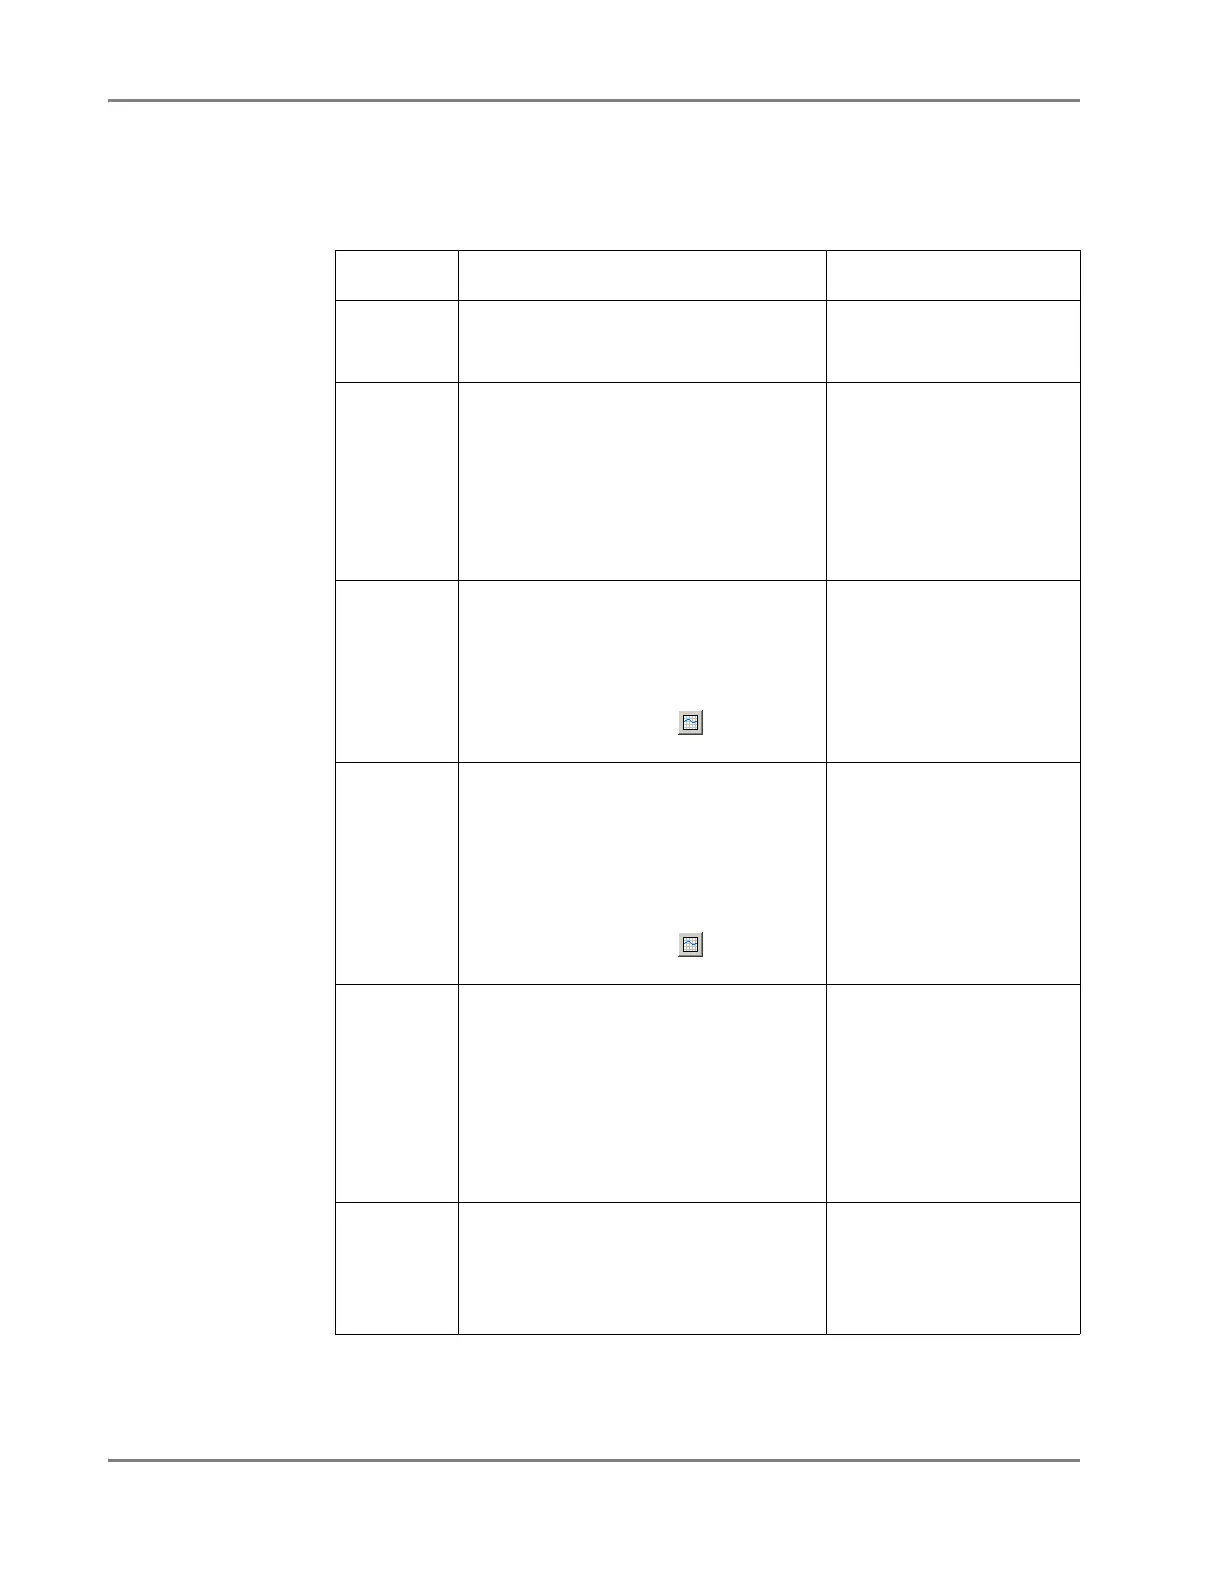
Plate documents can have up to six tabs (depending on their function) as described
below:
Table 2-5 Tabs of the SDS Software
Tab Function Views/Plots
Setup Displays well information, and allows you
to configure the plate grid with setup
information.
Well Inspector
Instrument Used to program the plate document
method, run the plate document, or send it
to the Plate Queue.
•Method Editor
– Thermal Profile tab
– Auto Increment tab
– Ramp Rate tab
– Data Collection tab
• Real-Time tab
• Plate-Read tab
Raw Data
Plot
Displays the raw fluorescence collected
from the sequence detection run.
The Raw Data tab is visible only in plate
documents containing run data.
To view the tab, open a plate document
containing run data, click , then select
the Raw Data Plot tab.
Raw Data Plot
Calibration
Data
Displays the Background and Pure Spectra
calibration data used for the signal
normalization and multicomponenting
analysis of the run data.
The Calibration Data tab is visible only in
plate documents containing run data.
To view the tab, open a plate document
containing run data, click , then select
the Calibration Data tab.
Calibration Data
• Background Plot
•Pure Dyes Plot
Results Displays analyzed run data.
The Analysis tab is visible only in plate
documents containing analyzed run data.
Allelic Discrimination Data
• Allelic Discrimination Plot
Absolute Quantification
• Amplification Plot
• Standard (Curve) Plot
Relative Quantification
• Amplification Plot
Dissociation
Curve
Displays analyzed dissociation curve data
from a programmed ramp.
The tab is visible only in plate documents
containing analyzed data from a real-time
run with a programmed ramp.
Dissociation Plot
 Loading...


