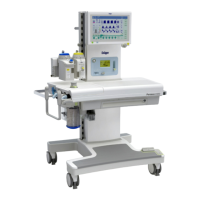
Chapter 8 - Monitoring Displayed Parameters
112 Apollo Operator’s Manual
Part Number: 90 38 237, 6th edition
Anesthetic Gas
• Curve display
• Numerical display:
- inAgent (inspiratory gas concentration)
- exAgent (expiratory gas concentration)
• MAC (minimum alveolar concentration)
• Trend curve for anesthetic gases and MAC
Airway Pressure
• Curve display (PAW)
• Numerical display:
- PEAK (peak pressure)
- PLAT (plateau pressure)
- PEEP (positive end-expiratory pressure)
- MEAN (mean pressure) (only on data screen)
• Bar graph
Respiratory Flow and Volume
• Curve display for flow (insp/exp)
• Numerical display:
- M
V (expiratory minute volume)
- V
T (tidal volume)
- V
TINSP (measured inspiratory tidal volume)
- ∆V
T (difference between inspiratory and
expiratory tidal volume)
- Freq (respiratory rate)
- MV
LEAK (difference between the inspiratory
and expiratory minute volume) (only
on data screen)
- C
PAT
*
(patient lung compliance) (only on data
screen)
• Trend curve for M
V and CPAT
•VT bar graph
*
CPAT = with mandatory breaths.
SpO
2
Concentration (Optional)
• Curve display (plethysmogram)
• Numerical display:
- SpO
2
(functional O
2
saturation level of blood)
- ♥ (pulse rate)
• Trend curve for SpO
2
and pulse
Loops (Optional)
Shows two pairs of measured values that are plotted
against each other. Each pair appears as a loop: the
Pressure/Volume loop and the Flow/Volume loop.
See “Loops (Optional)” on page 120 for more
detailed information.
V
T
(PLAT - PEEP)