Displayed Parameters Chapter 8 - Monitoring
Apollo Operator’s Manual 115
Part Number: 90 38 237, 6th edition
The Low Flow Wizard
.
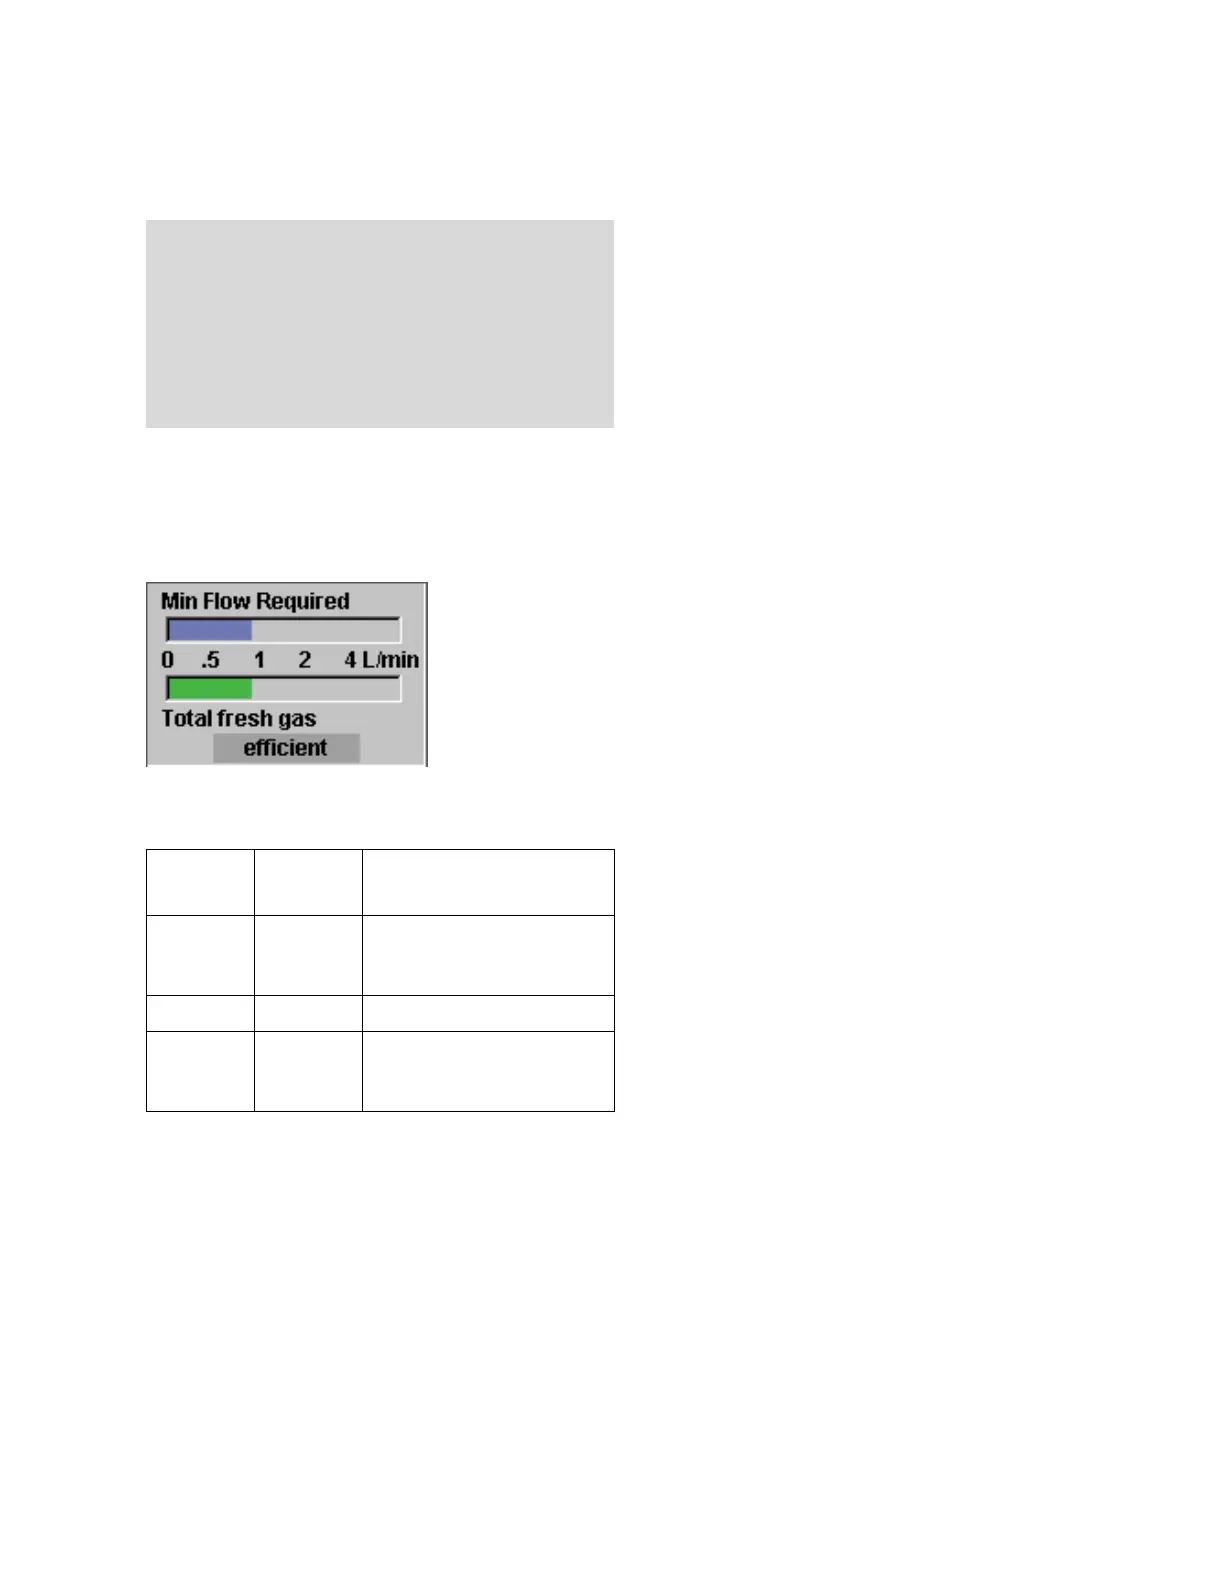
The low flow wizard shows bar graphs for the
minimum required flow (leak and uptake) and for the
total fresh-gas flow. Both graphs have the same
scale.
The total fresh-gas flow bar graph has three ranges:
Gas consumption depends on patient uptake,
leakage, and the CO
2
volume converted in the
absorber.
If fresh gas data is unavailable, the bar graph will be
inactive and the text will appear grayed out.
WARNING !
This tool should not be used when higher flows
are required such as during induction,
emergence, or other times when rapid changes
to the concentration of gases in the circuit are
desired, or when the chemical pharmacology of
the agent being used indicates otherwise.
Indication
Bar graph
color
Meaning
too much yellow fresh gas delivery is more
than 1 L/min above the gas
consumption (leak + uptake)
efficient green fresh gas delivery efficient
too little red fresh gas delivery less than
minimum flow required (leak
+ uptake)