Chapter 8 - Monitoring Displayed Parameters
116 Apollo Operator’s Manual
Part Number: 90 38 237, 6th edition
Volumeter Module
The volumeter module shows the tidal volume (VT)
and minute volume as bar graphs. The scales can be
configured by the user (see the “Configuration”
chapter for more information.)
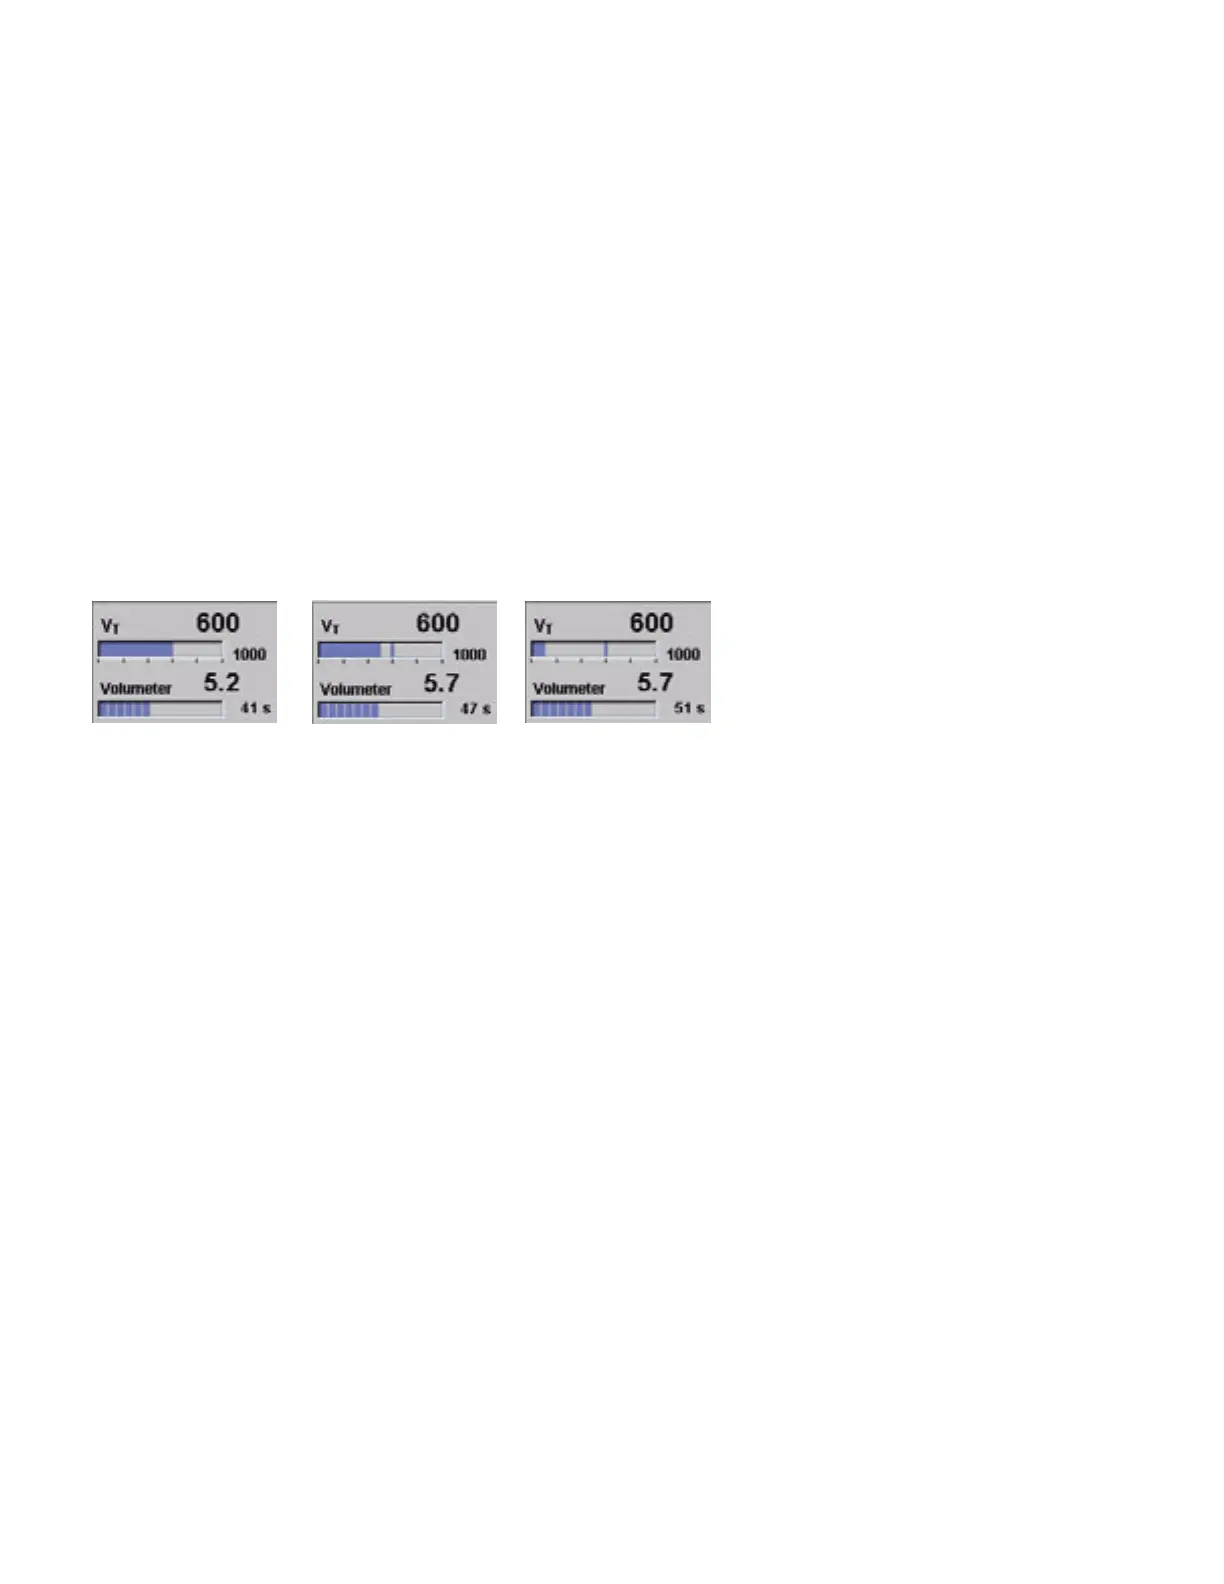
Tidal Volume (Upper) Graph
The tidal volume graph increases during the
inspiratory flow and decreases during the expiratory
flow. A blue vertical line remains on the graph to
indicate the inspiratory volume, while the bar recedes
from the line to indicate the expiratory phase.
The expiratory tidal volume is shown in numerics
above the graph. Leakage is indicated by the bar
remaining in the graph at the end of the expiratory
phase.
.
The Minute Volume (Lower) Graph
The minute volume, or volumeter, provides a
graphical and numerical indication of the expiratory
minute volume. Each unit in the graph represents
one breath. The total volume is shown above the
graph and the expired time is shown beside the
graph in seconds. The measured values are
displayed for four minutes and then deleted.
To start the volumeter:
• Push the confirm knob.
The measurement begins and stops
automatically after 60 seconds. The volumeter is
stopped if the confirm knob is pushed again
within 60 seconds; the values are deleted and
the confirm knob must be pushed again to
restart.
Inspiratory phase Expiratory phase End of expiratory phase