10. If log fidelity is poor near the bottom of the screen or the 1 MHz resolution bandwidth is
narrow, a fault might exist in the wide/narrow filter switch. Refer to function block G
of A4 Log Amplifier Schematic Diagram in the
HP 856UA/6lB/63A Spectrum Analyzer
Component Level Information binder. Check this switch as follows:
a. Monitor voltages on
A4U302 pins 1 and 7 while changing the spectrum analyzer
resolution bandwidth from 100 kHz to 300 kHz.
b. If the voltages do not come within a few volts of the
+15
V and -15 V supplies,
U103
and
U302
are suspect.
c. Disconnect the digital multimeter and reconnect W27 to A4J3.
Linear Amplifiers
Refer to function block C of A4 Log Amplifier Schematic Diagram (sheet 2 of 4) in the
HP
856OA/61B/63A
Spectrum Analyzer Component Level Information binder.
The Linear Amps consist of two variable gain stages, U2OlC and U201E as well as the buffer
amplifier A4U201B, A4U201D, and A4Q201. The linear amplifiers provide 0 to 40 dB of IF
gain in 10 dB steps. The gain of A4U201C can be increased by 20 dB by turning on A4CR201
and A4CR210 with the control line LIN_20B. The gain of A4U201E can be increased by either
10 dB or 20 dB with the control lines LIN_10 or LIN_20A respectively. The gain can be
selected by setting the spectrum analyzers reference level.
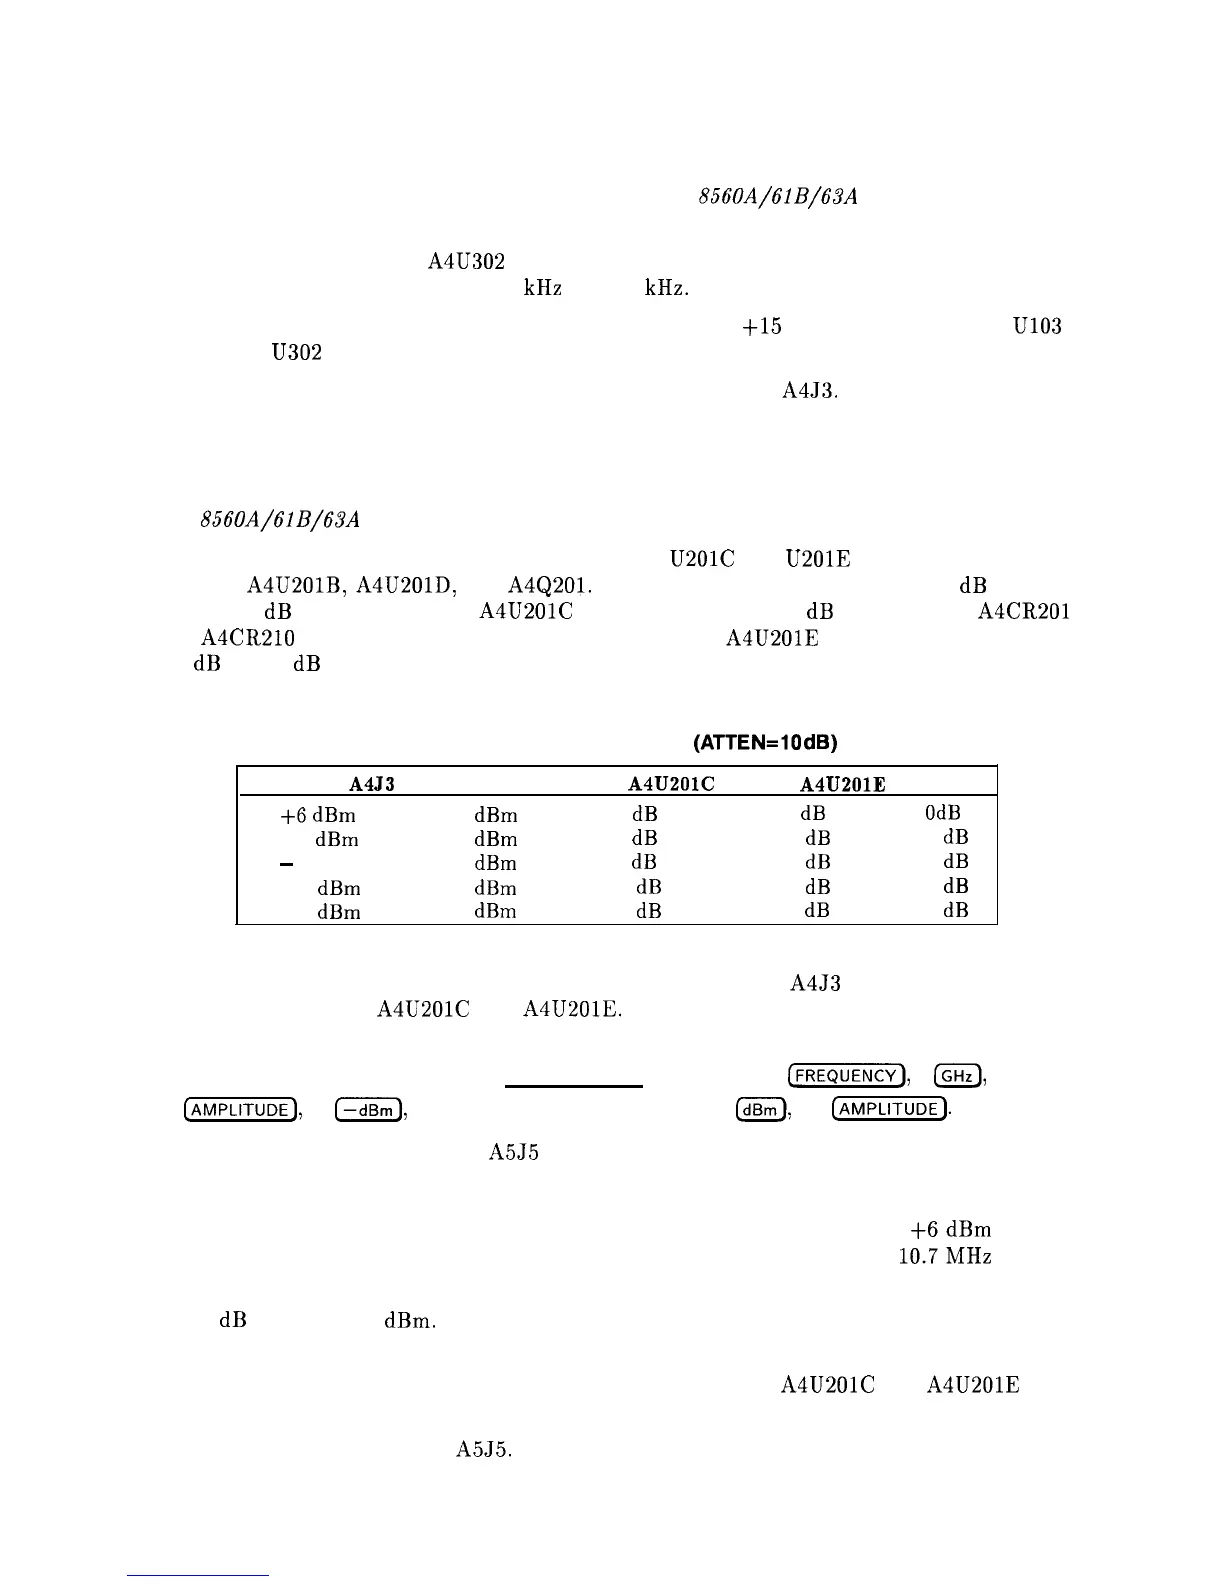
IF Gain Application Guidelines
(ATTEN=lO
dB)
Power into
A4J3
Reference Level Gain of
A4U201C
Gain of
A4U201E
Total Gain
+6
dBm
-50
dBm
0
dB
0
dB
OdB
-4
dBm
-60
dBm
0
dB
10
dB
10
dB
-
14dBm
-70
dBm
0
dB
20
dB
20
dB
-24
dBm
-80
dBm
20
dB
10
dB
30
dB
-34
dBm
-90
dBm
20
dB
20
dB
40
dB
Total gain can be measured by injecting the specified power into A4J3 and measuring the
total gain provided by A4U201C and A4U201E. The following procedure provides a means of
troubleshooting the linear amplifiers.
1. On the spectrum analyzer press (PRESET), (SPAN), ZERO SPAN ,
(w),
1
IGHz),
(-1,
50
(--dBm],
LINEAR, MORE, AMPTD UNITS ,
m,
and
(-1.
2. Disconnect W27 (coax 3) from A5J5 and connect W27 to the output of a signal generator.
3. Set the signal generator controls as follows:
Amplitude
. . . . . . . . . . . . . . . . . . . . . . . . . . . . . . . . . . . . . . . . . . . . . . . . . . . . .
+6dBm
Frequency
. . . . . . . . . . . . . . . . . . . . . . . . . . . . . . . . . . . . . . . . . . . . . . . . . . . .
10.7MHz
4. Simultaneously decrease the signal generator output and spectrum analyzer REF LVL in
10
dB steps to -90
dBm.
At each step, the signal displayed on the spectrum analyzer
should be within one division of the previous position.
5. If a problem exists, isolate it by comparing the actual gain of A4U201C and A4U201E with
those listed in the above gain guidelines.
6. Reconnect W27 (coax 3) to
A5J5.
IF Section 8-15