RE
5
dB,’
SAMPLE
CENTER
F/
I”.;
dBmi
ATTEN
20
dB
1
I
I
I
I
10.700 000
MHz
SPAN 0 Hz
RES BW 300
kHz
VBW 300
kHz
SWP 500
set
SK181
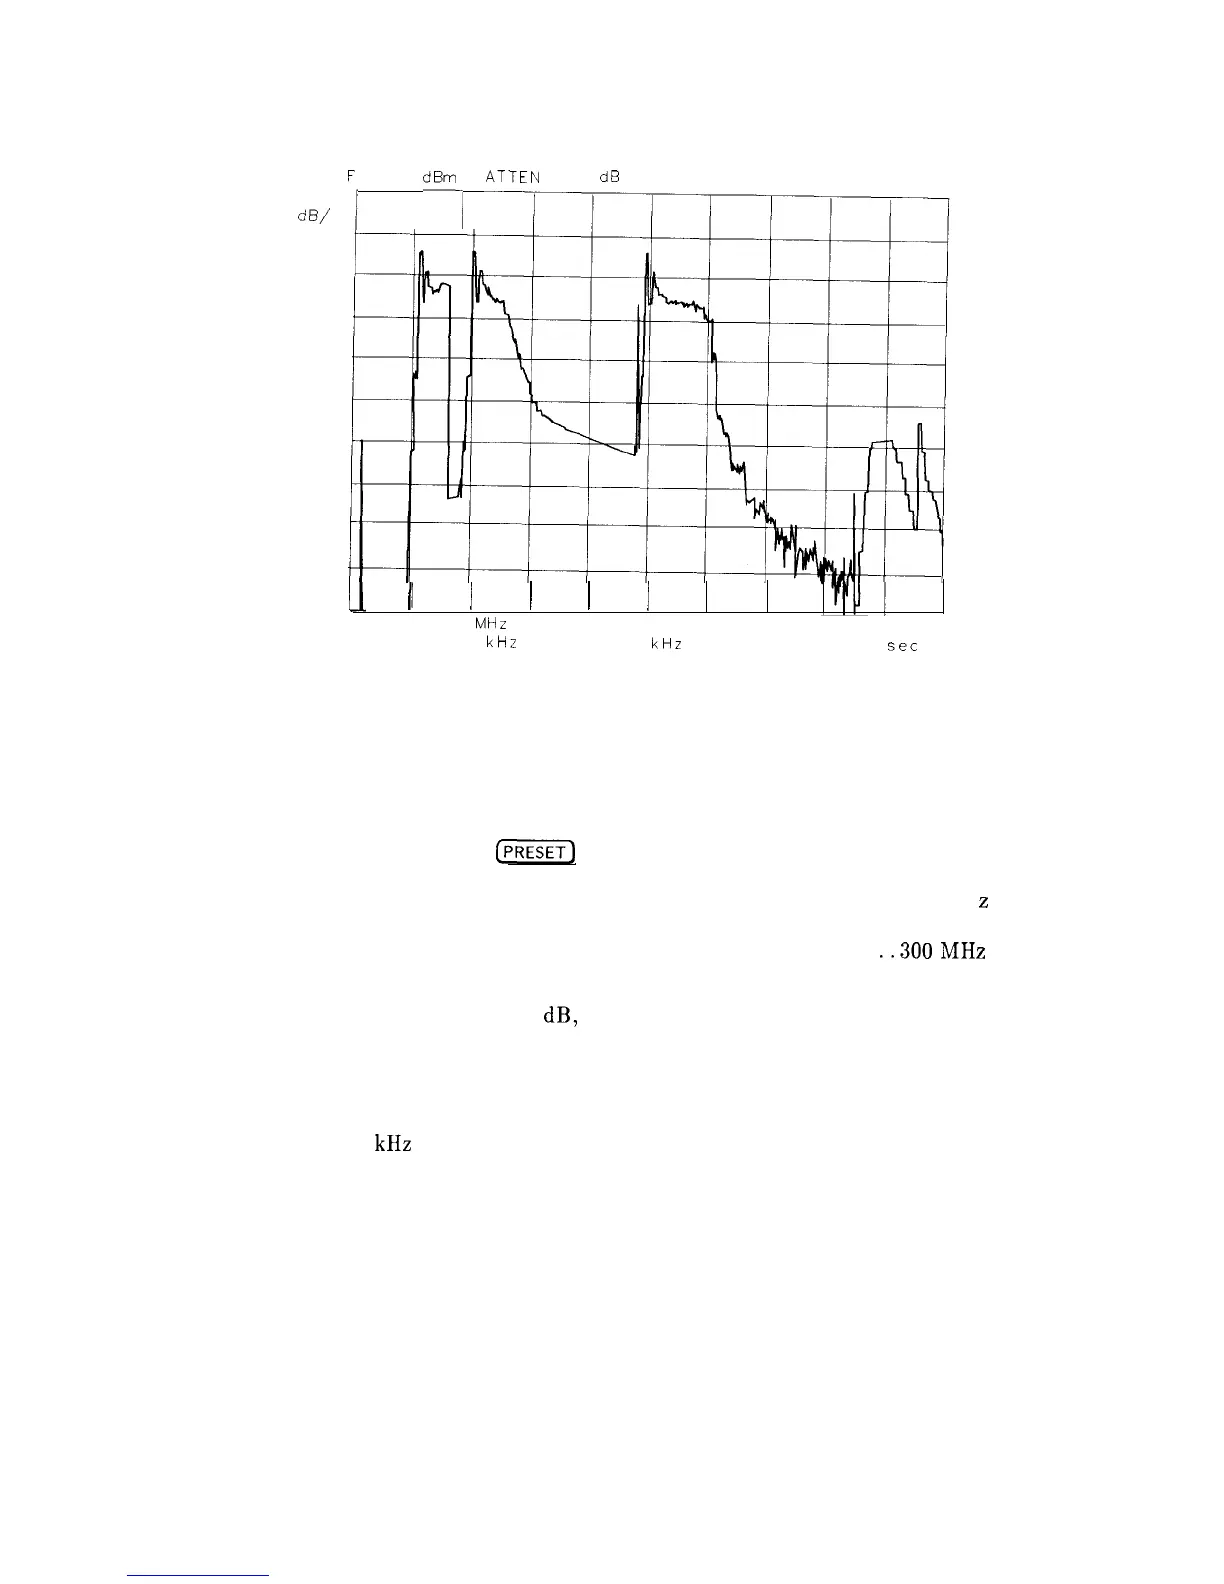
Figure 8-12. Region B Amplitude Offset
1 MHz Resolution Bandwidth Problems
Check the crystal shorting switches as follows:
1. On the spectrum analyzer, press
[PRESET)
and set the controls as follows:
RES BW
......................................................
..lMH
z
SPAN.........................................................
500kHz
FREQUENCY
...............................................
..300MH
z
2. On the spectrum analyzer, connect the 300 MHz CAL OUTPUT to the INPUT 50ohm.
3. If the trace flatness is not within 2.5
dB, a failure probably exists.
4. A trace similar to Figure 8-13 indicates a crystal short failure.
5. Set the spectrum analyzer (SPAN) to 3 MHz. A trace that slopes across the screen (see
Figure 8-14) indicates a failed LC pole. To isolate the broken pole refer to the shape factor
information in “30
kHz Resolution Bandwidth Problems.”
8-30 IF Section