Browsing Your History and Records 11
128
11 Browsing Your History and Records
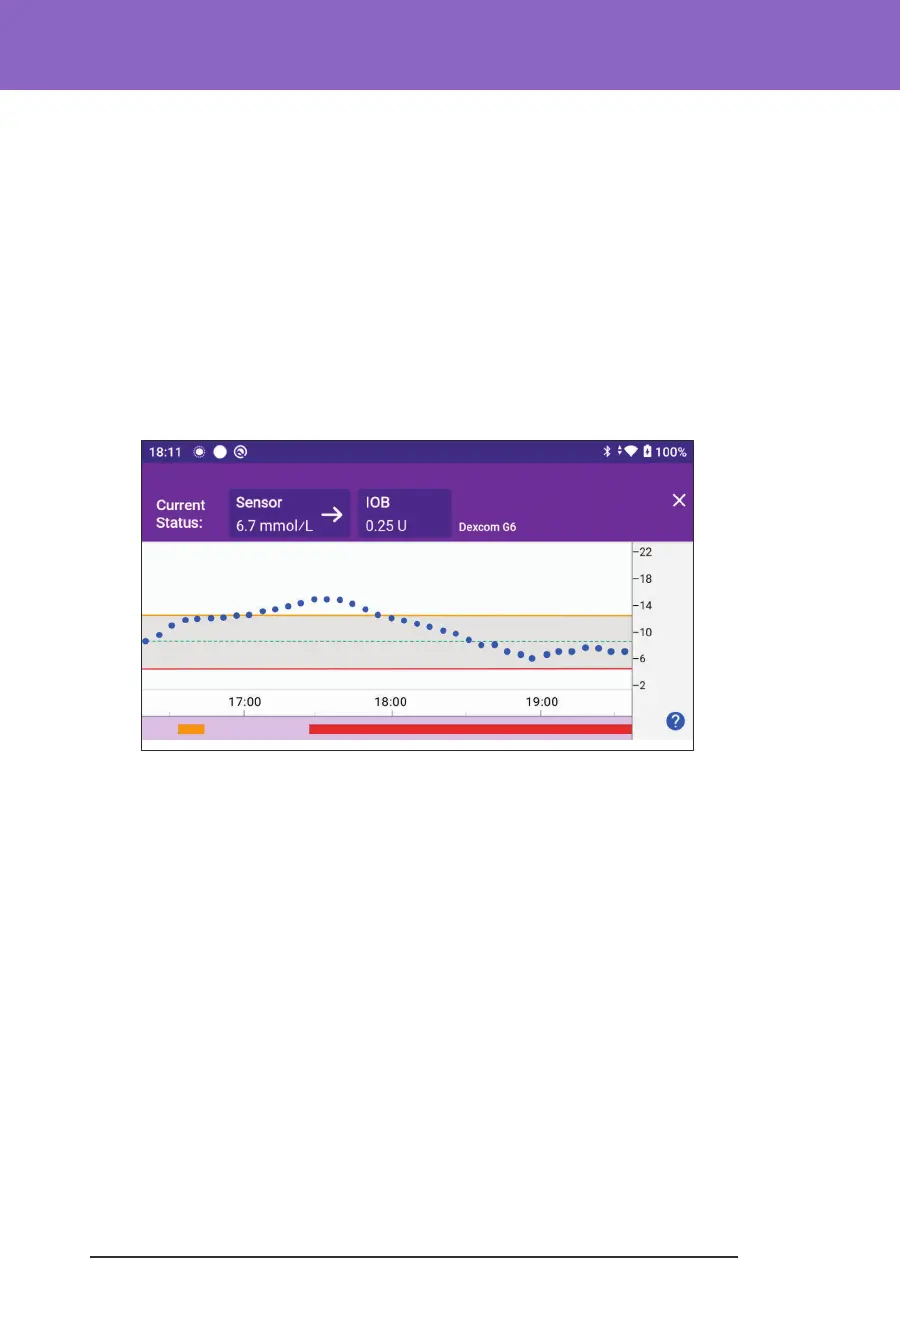
• A dark grey background when Omnipod 5 was delivering insulin in
Automated Mode: Limited state
• A red line during the time that SmartAdjust technology paused insulin
• An orange line during time that the maximum amount of basal insulin
was delivered by the Omnipod 5 System
• e bolus button at the time you started a bolus
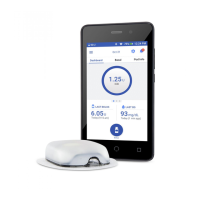
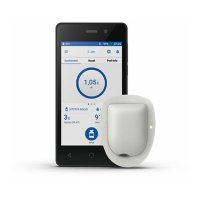
6. Vertical axis: Displays sensor glucose values in mmol/L
7. Time scale: Displays hour and half-hour markings.
When the Omnipod 5 System is in Automated Mode, the graph heading is purple.