129
Browsing Your History and Records 1111 Browsing Your History and Records
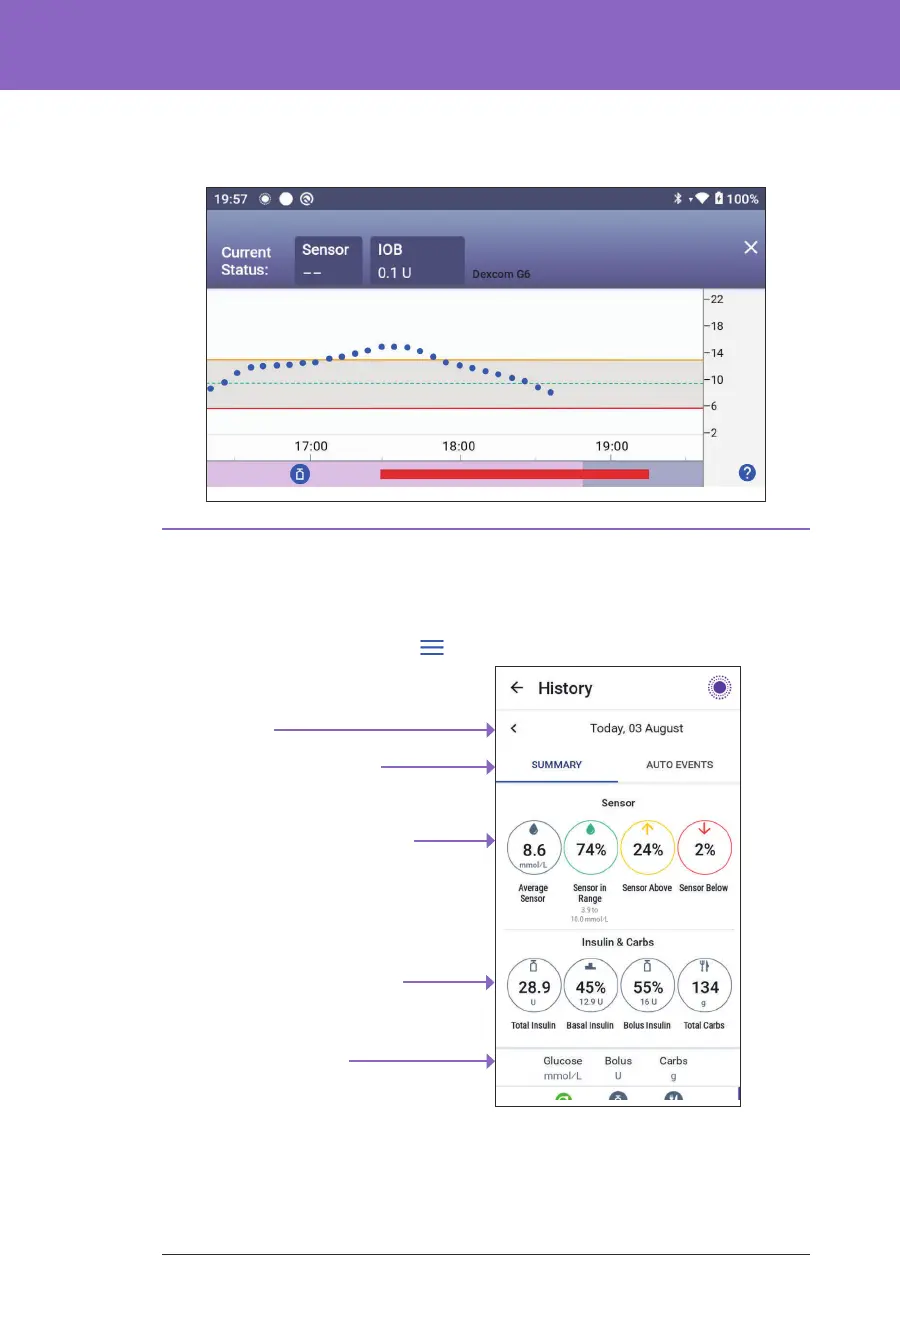
When the Omnipod 5 System is in Automated Mode: Limited state, the graph
heading is dark grey.
11.4. History Information Overview
You can access the history summary and detail information, and a list of
automated events from the History Detail screen.
¾ Navigate to: Menu button ( ) > History Detail.
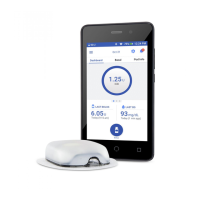
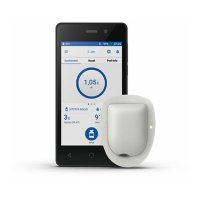
Details section
- Swipe to see expanded details
Insulin and Carb
summary
Glucose Summary
Summary Section
-Tap AUTO EVENTS to see
automated event details
Date
Today's history records are displayed below the summary circles, beginning with
the newest records on the top.
• A dark grey background when Omnipod 5 was delivering insulin in
Automated Mode: Limited state
• A red line during the time that SmartAdjust technology paused insulin
• An orange line during time that the maximum amount of basal insulin
was delivered by the Omnipod 5 System
• e bolus button at the time you started a bolus
6. Vertical axis: Displays sensor glucose values in mmol/L
7. Time scale: Displays hour and half-hour markings.
When the Omnipod 5 System is in Automated Mode, the graph heading is purple.