Overview of the Omnipod 5 System Pivotal Clinical Study 25
304
25 Overview of the Omnipod 5 System Pivotal Clinical Study
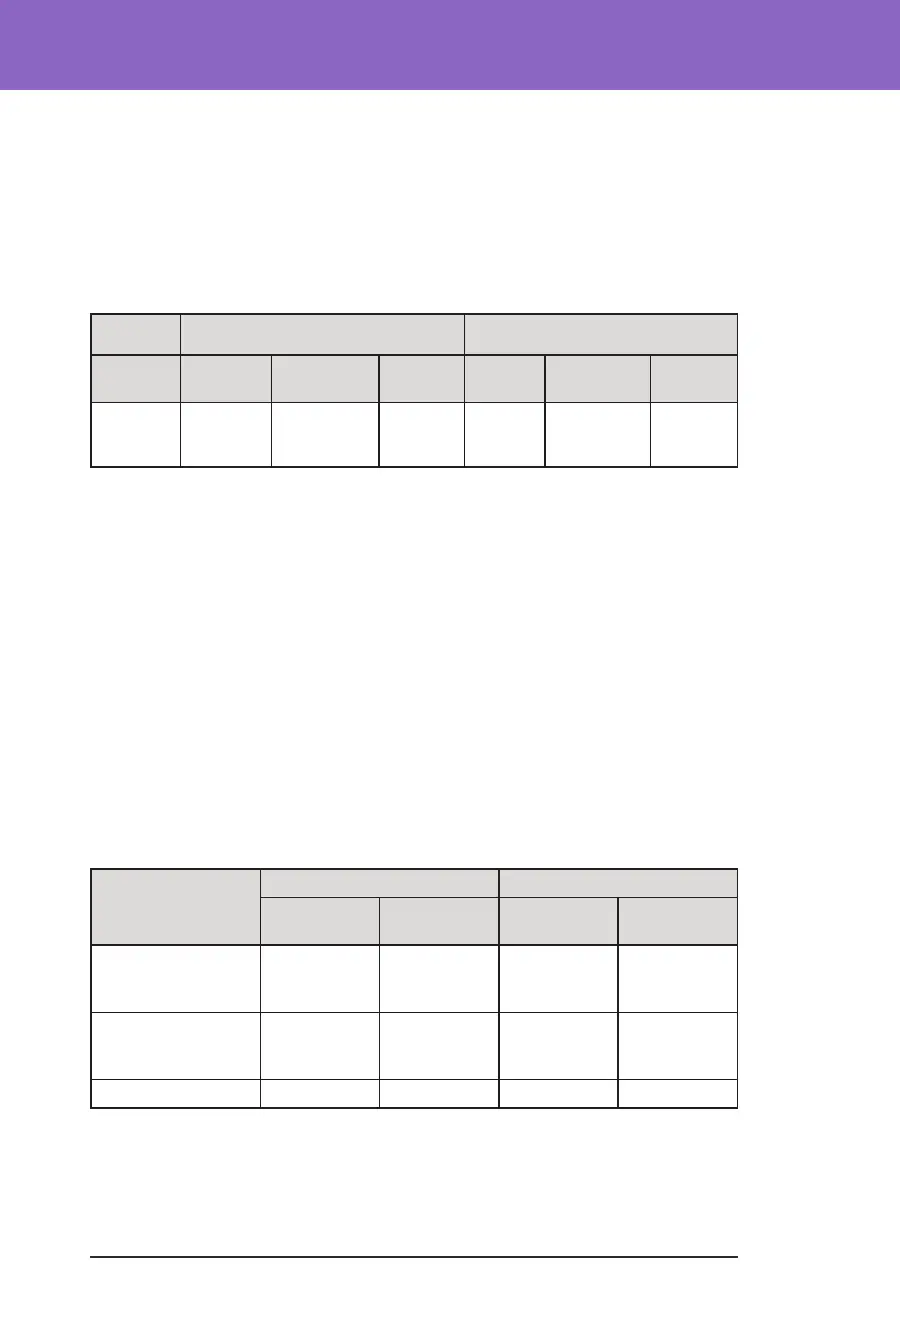
Change in A1C Analysed by Baseline A1C
e table below provides information on the average change in A1C% from
baseline to the end of the 3-month Omnipod 5 System treatment phase, analysed
by baseline A1C%. Participants experienced a reduction in A1C aer 3 months of
Omnipod 5 System use regardless of baseline A1C <8% or ≥8% category.
Subgroup Analysis of Change in Average A1C(%) by Baseline A1C(%)
Baseline A1C <8% (n=55) Baseline A1C ≥8% (n=25)
Baseline
Omnipod
5
Change Baseline
Omnipod
5
Change
A1C%
(std dev)‡
6.9%
(0.6%)
6.6%
(0.6%)
-0.31%*
8.5%
(0.5%)
7.5
(0.4%)
-1.06%*
*Change between the standard-therapy phase and the Omnipod 5 System phase was statisti-
cally signicant
‡Average A1C values are reported with standard deviation values in brackets.
Glycaemic Results by Baseline Treatment
e table below provides information on the average glycaemic results at baseline
(or during the standard-therapy phase) and the 3-month Omnipod 5 System
treatment phase, analysed by baseline treatment (standard therapy). Standard
therapy consisted of multiple daily insulin injections (MDI) or insulin pump
use. Time in range (3.9–10 mmol/L, 70–180 mg/dL) and A1C were improved
aer 3 months of Omnipod 5 System use, regardless of baseline treatment type.
Time <3.9 mmol/L (<70 mg/dL) improved in participants on an insulin pump at
baseline and remained low in those on MDI at baseline.
Subgroup Analysis of Average Glycaemic Results by Baseline Treatment
Characteristic
MDI (n=12) Insulin Pump (n=68)
Standard
Therapy
Omnipod 5
Standard
Therapy
Omnipod 5
% Time in range
3.9–10 mmol/L
(70–180 mg/dL)
48% 62%* 59% 69%*
% Time
<3.9 mmol/L
(<70 mg/dL)
‡
1.45% 1.48% 2.44% 2.00%*
A1C% 8.4% 7.5%* 7.3% 6.8%*
*Change between the standard-therapy phase and the Omnipod 5 System phase was
statistically signicant
‡ Values presented for % Time <3.9 mmol/L (<70 mg/dL) are medians; the remaining values
in the table are averages.