307
Overview of the Omnipod 5 System Pivotal Clinical Study 2525 Overview of the Omnipod 5 System Pivotal Clinical Study
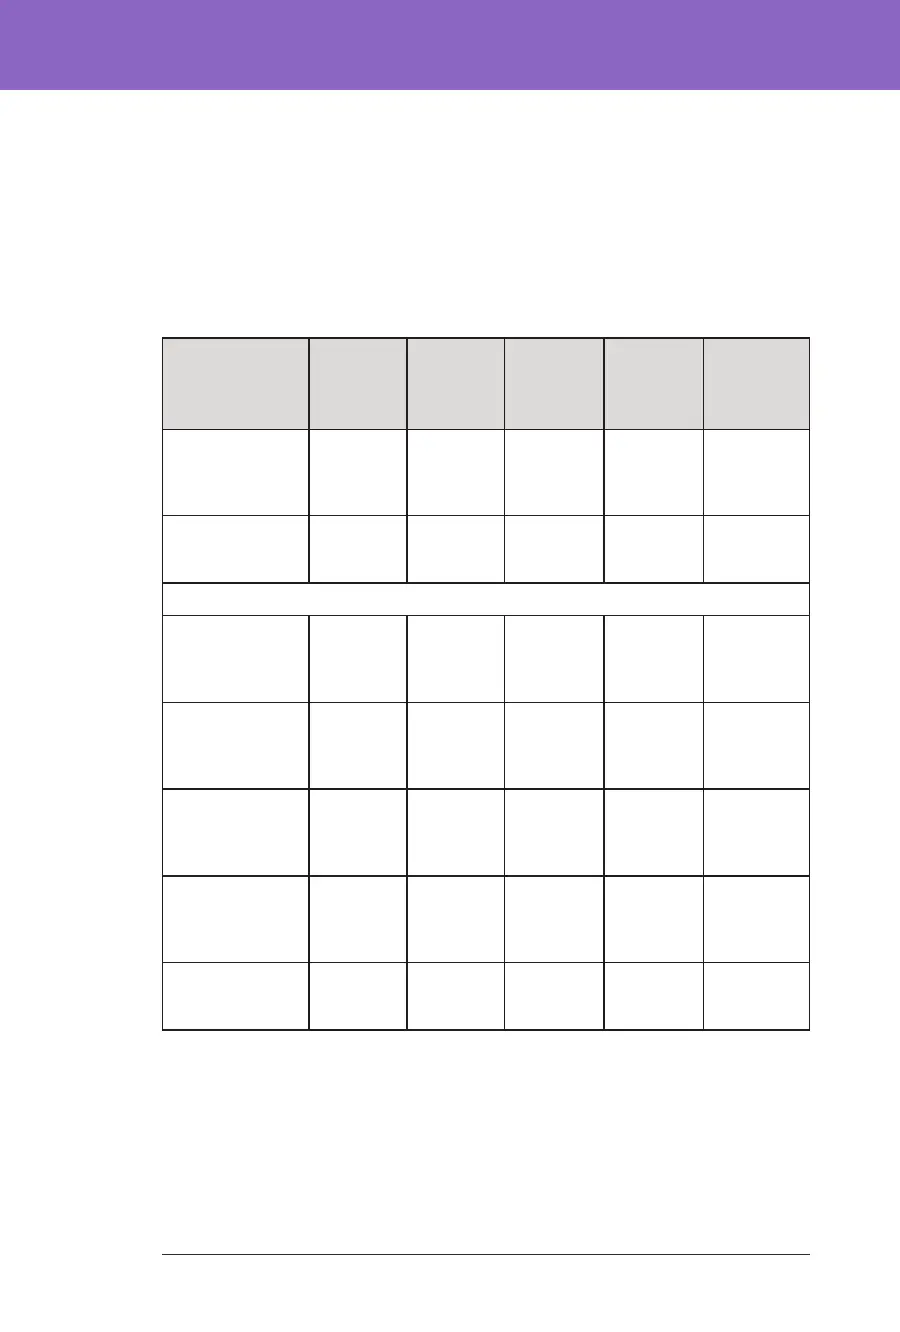
Glycaemic Results at Target Glucose Settings
e tables below provide information on the glycaemic results at various self-
selected Target Glucose settings during the 3-month Omnipod 5 System phase of
the pivotal study. e most commonly selected target glucose values were
6.1 mmol/L (110 mg/dL) and 6.7 mmol/L (120 mg/dL), which were used 33% and
42% of the time, respectively.
Overall (24 hours) Glycaemic Results at Target Glucose Settings
Characteristic
6.1 mmol/L
(110 mg/dL)
Target Glucose
(n=47)
6.7 mmol/L
(120 mg/dL)
Target Glucose
(n=61)
7.2 mmol/L
(130 mg/dL)
Target Glucose
(n=47)
7.8 mmol/L
(140 mg/dL)
Target Glucose
(n=20)
8.3 mmol/L
(150 mg/dL)
Target Glucose*
(n=16)
Avg % time
3.9–10 mmol/L,
70–180 mg/dL,
(std dev)
69.3%
(9.5%)
68.3%
(11.3%)
67.3%
(14.6%)
63.0%
(11.9%)
65.0%
(15.0%)
Avg sensor
glucose, mmol/L,
mg/dL, (std dev)
8.5, 153
(1, 18)
8.7, 157
(1.2, 21)
8.9, 161
(1.4, 25)
9.4, 169
(1, 18)
9.4, 169
(1.1, 20)
% Time in glucose range
Median %
<3 mmol/L,
<54 mg/dL,
(Q1, Q3)
0.3%
(0.2, 0.7)
0.2%
(0.1, 0.5)
0.2%
(0.05, 0.7)
0.2%
(0.03, 0.5)
0.06%
(0.0, 0.2)
Median %
<3.9 mmol/L,
<70 mg/dL,
(Q1, Q3)
2.4%
(1.5, 3.9)
1.6%
(1.1, 2.7)
1.4%
(0.6, 2.9)
1.4%
(0.4, 2.7)
0.8%
(0.1, 2.0)
Avg %
>10 mmol/L,
>180 mg/dL
(std dev)
27.6%
(10.5%)
29.3%
(12.1%)
30.4%
(15.4%)
35.4%
(12.2%)
33.9%
(15.0%)
Avg %
≥13.9 mmol/L,
≥250 mg/dL
(std dev)
7.7%
(5.9%)
8.9%
(6.2%)
10.6%
(9.4%)
12.6%
(6.2%)
11.4%
(7.2%)
Cumulative
number of
person-days
2438.4 3083.5 1066.6 404.0 237.0
*Glycaemic measures reported at the 8.3 mmol/L (150 mg/dL). Target Glucose
setting only included those with the Activity feature turned OFF.