299
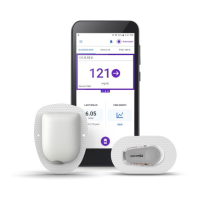
Overview of the Omnipod 5 System Pivotal Clinical Study 2525 Overview of the Omnipod 5 System Pivotal Clinical Study
CGM-Informed SmartBolus Calculator Clinical Study in
Children, Adolescents and Adults
A study was conducted on 25 participants with type 1 diabetes aged 6-70 years to
assess the Omnipod 5 Sensor-informed SmartBolus Calculator. During Phase
1, participants used the Omnipod 5 system in Manual Mode for the rst 7 days
without a connected Sensor (standard SmartBolus Calculator). In Phase 2,
participants used the Omnipod 5 system in Manual Mode with a connected
Sensor (CGM-informed SmartBolus Calculator) for 7 days. Boluses were
calculated using stored pump settings plus a user-estimated meal size and/or
either a manually entered glucose value (standard SmartBolus Calculator) or an
imported current sensor glucose value and trend (CGM-informed SmartBolus
Calculator). Both versions of the SmartBolus Calculator considered insulin
on board (IOB) in the bolus calculations. e CGM-informed calculator
automatically increased or decreased the suggested bolus amount based on
the sensor glucose trend. e primary analysis of the study was to compare the
percentage of time spent <3.9 mmol/L (<70 mg/dL) and >10 mmol/L
(>180 mg/dL) for the 4 hours aer any bolus, as measured by the Sensor between
the two study phases. e results indicate that the use of the Sensor-informed
SmartBolus Calculator was associated with less time in hypoglycaemia within
4 hours of bolusing.
Comparison of Glycaemic Measures from Phase 1 (Standard SmartBolus
Calculator) and Phase 2 (CGM-Informed SmartBolus Calculator) for the
4hours After any Bolus (n=25)
Percentage time in glucose
range as measured by the
Sensor
Standard
SmartBolus
Calculator
CGM-Informed
SmartBolus
Calculator
Dierence
3.9–10 mmol/L
(70–180 mg/dL)
65.1%
(15.4)
63.8%
(15.7)
-1.3%
<3.9 mmol/L
(<70 mg/dL)
2.8%
(2.7)
2.1%
(2.0)
-0.6%*
<3 mmol/L
(<54 mg/dL)
0.5%
(1.0)
0.3%
(0.7)
-0.2%
>10 mmol/L
(>180 mg/dL)
32.1%
(15.7)
34.0%
(16.0)
1.9%
≥13.9 mmol/L
(≥250 mg/dL)
8.2%
(6.9)
9.7%
(10.3)
1.4%
≥16.7 mmol/L
(≥300 mg/dL)
2.0%
(2.6)
2.6%
(3.7)
0.6%
Data is presented as average (standard deviation). Signicant dierences (p<0.05) are highlighted with
an asterisk.