R&S
®
ZVA / R&S
®
ZVB / R&S
®
ZVT GUI Reference
Trace Menu
Operating Manual 1145.1084.12 – 30 178
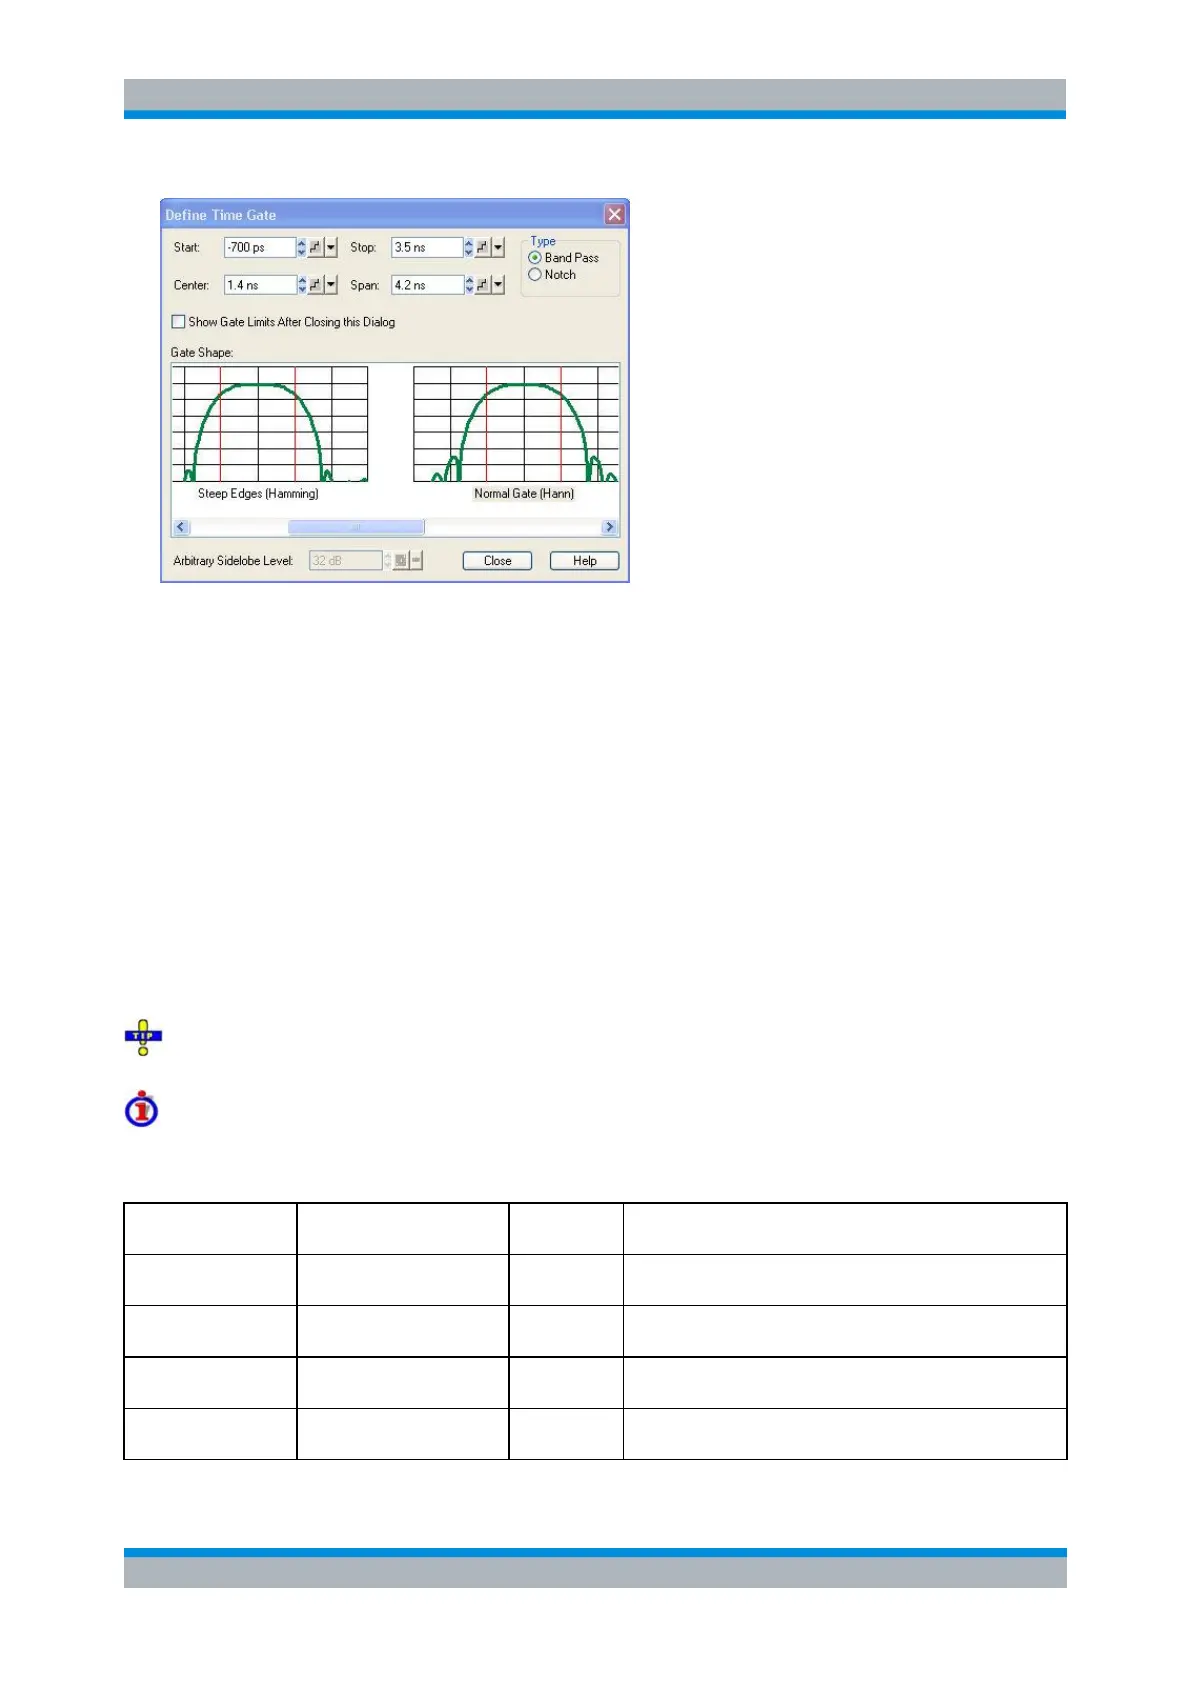
Start and Stop or Center and Span define the size of the time gate. Please make sure that the
selected time span does not exceed the unambiguous range which is given by Δt = 1/Δf, where Δf
is the spacing between two consecutive frequency points.
The filter Type defines what happens to the data in the specific time region. A Band Pass filter
passes all information in the specified time region and rejects everything else. A Notch filter
rejects all information in the specified time region and passes everything else.
If the Show Gate Limits after Closing this Dialog check box is selected two red lines indicating the
start and stop of the time gate are permanently displayed in the diagram area.
The Gate Shape panel visualizes how the time gate will affect a constant function after
transformation back into the frequency domain. The selected window is applied to the active trace.
The two red vertical lines represent the Start and Stop values defining the size of the time gate.
The analyzer always uses a Steepest Edges (Rectangle) window to calculate the time-gated
frequency domain trace, see background information is section Frequency Domain.
If an Arbitrary Gate Shape (Dolph-Chebychev) window is selected, the Arbitrary Sidelobe Level
can be set below the Gate Shape diagrams.
Use the paste marker list for convenient entry of Start and Stop values.
Comparison of time gates
The properties of the time gates are analogous to the properties of the frequency domain windows. The
following table gives an overview:
Steepest Edges
(Rectangle)
Eliminate small distortions in the vicinity of the useful signal,
if demands on amplitude accuracy are low
Good compromise between edge steepness and sidelobe
suppression
Good compromise between edge steepness and sidelobe
suppression
Maximum Flatness
(Bohman)
Maximum attenuation of responses outside the gate span