SCALANCE W User Interface
6.2 Main Window
SCALANCE W1750D UI
68 Configuration Manual, 02/2018, C79000-G8976-C451-02
The
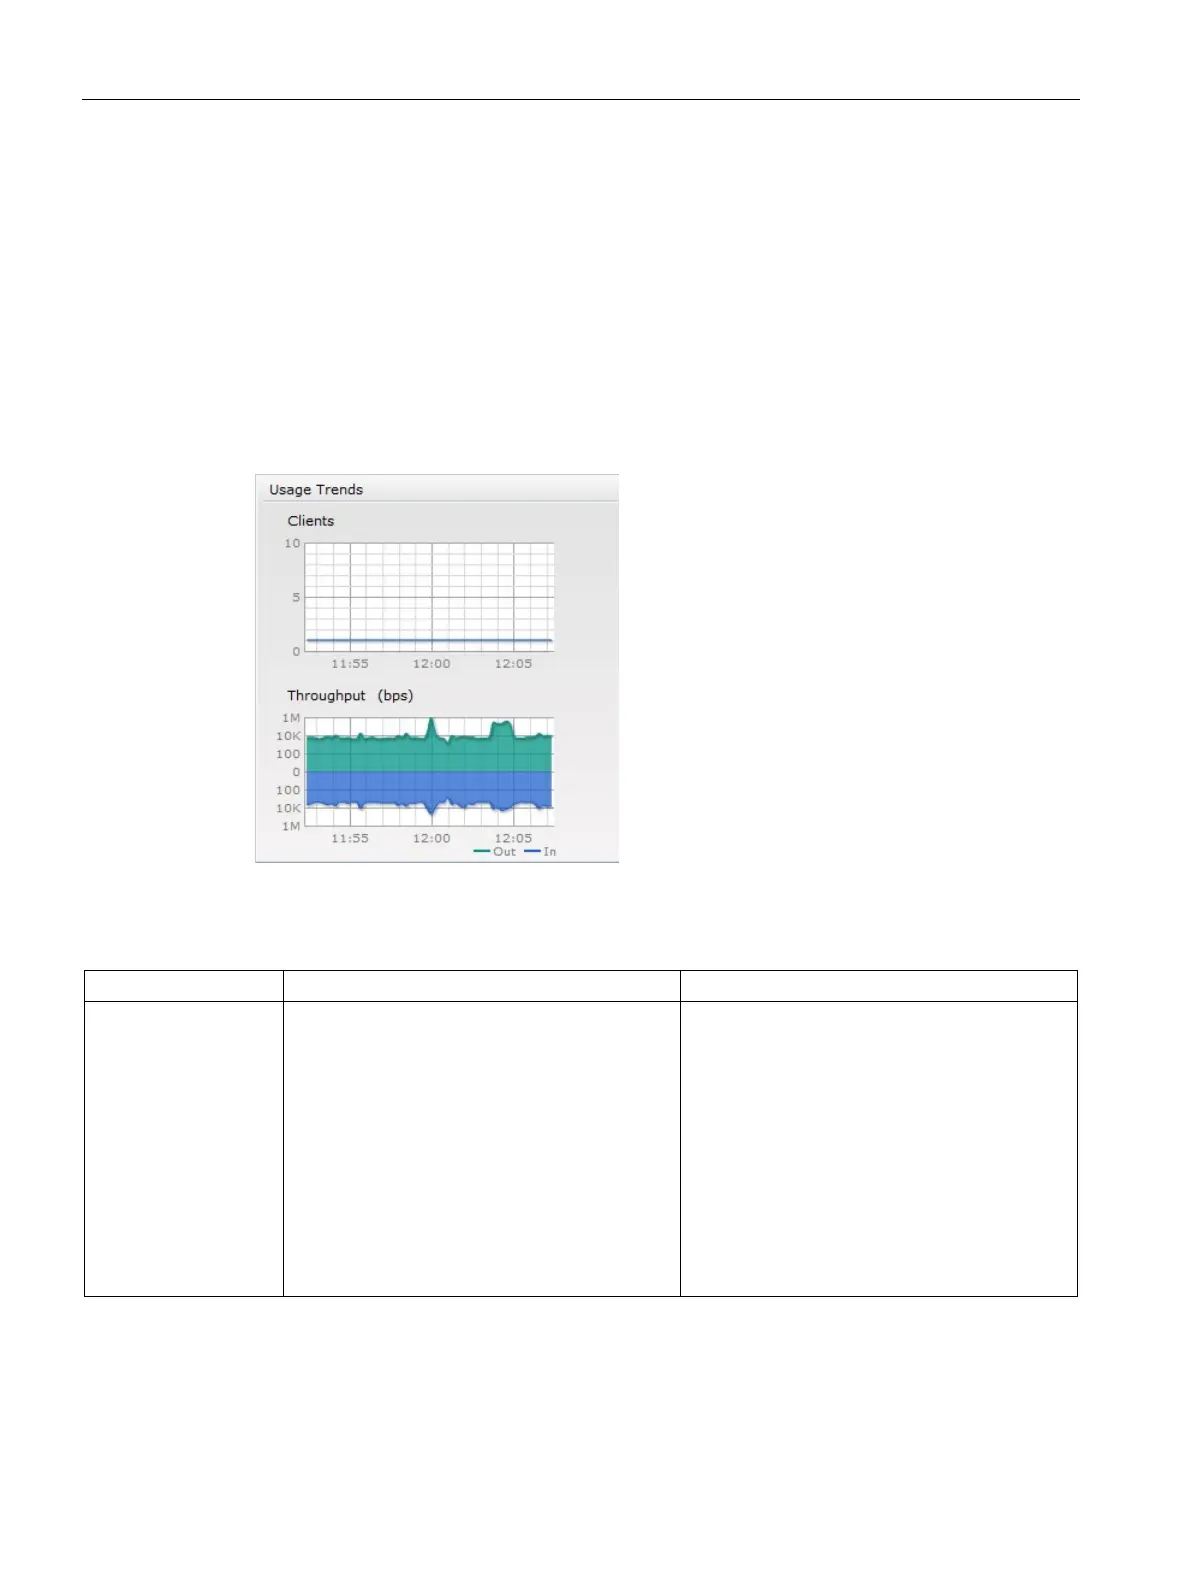
section displays the following graphs:
●
— In the default view, the Clients graph displays the number of clients that were
associated with the VC in the last 15 minutes. In Network view or the Access Point view,
this graph displays the number of clients that were associated with the selected network
or AP in the last 15 minutes.
●
— In the default view, the Throughput graph displays the incoming and
outgoing throughput traffic for the VC in the last 15 minutes. In the Network view or the
Access Point view, this graph displays the incoming and outgoing throughput traffic for
the selected network or AP in the last 15 minutes.
Figure 6-12
Usage Trends Graphs in the Default View
The following table describes the graphs displayed in the Network view:
Clients The Clients graph shows the number of clients
associated with the network for the last 15
minutes.
To see an enlarged view, click the graph.
• The enlarged view provides Last, Minimum,
Maximum, and Average statistics for the
number of clients associated with the VC for
the last 15 minutes.
• To see the exact number of clients in the
SCALANCE W network at a particular time,
move the cursor over the graph line.
To check the number of clients associated with
the network for the last 15 minutes:
1. Log in to the SCALANCE W UI. The Virtual
Controller view is displayed. This is the
default view.
2. On the
tab, click the network for
which you want to check the client associa-
tion.
3. Study the Clients graph in the
pane. For example, the graph shows that
one client is associated with the selected
network at 12:00 hours.
 Loading...