SCALANCE W User Interface
6.2 Main Window
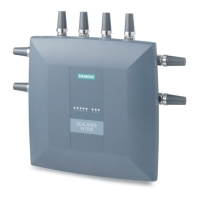
SCALANCE W1750D UI
72 Configuration Manual, 02/2018, C79000-G8976-C451-02
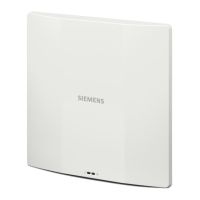
If Client Match is enabled, the
link provides a graphical representation of radio
map view of an AP and the client distribution on an AP radio.
On clicking an access point in the
tab and the
link, a stations
map view is displayed and a graph is drawn with real-time data points for the APradio. If the
AP supports dual-band, you can toggle between 2.4 GHz and 5 GHz links in the Client
Match graph area to view the data. When you hover the mouse on the graph, details such as
RSSI, Client Match status, and the client distribution on channels are displayed.
The following figure shows the client distribution details for an AP radio.
Figure 6-13
Client Distribution on AP Radio
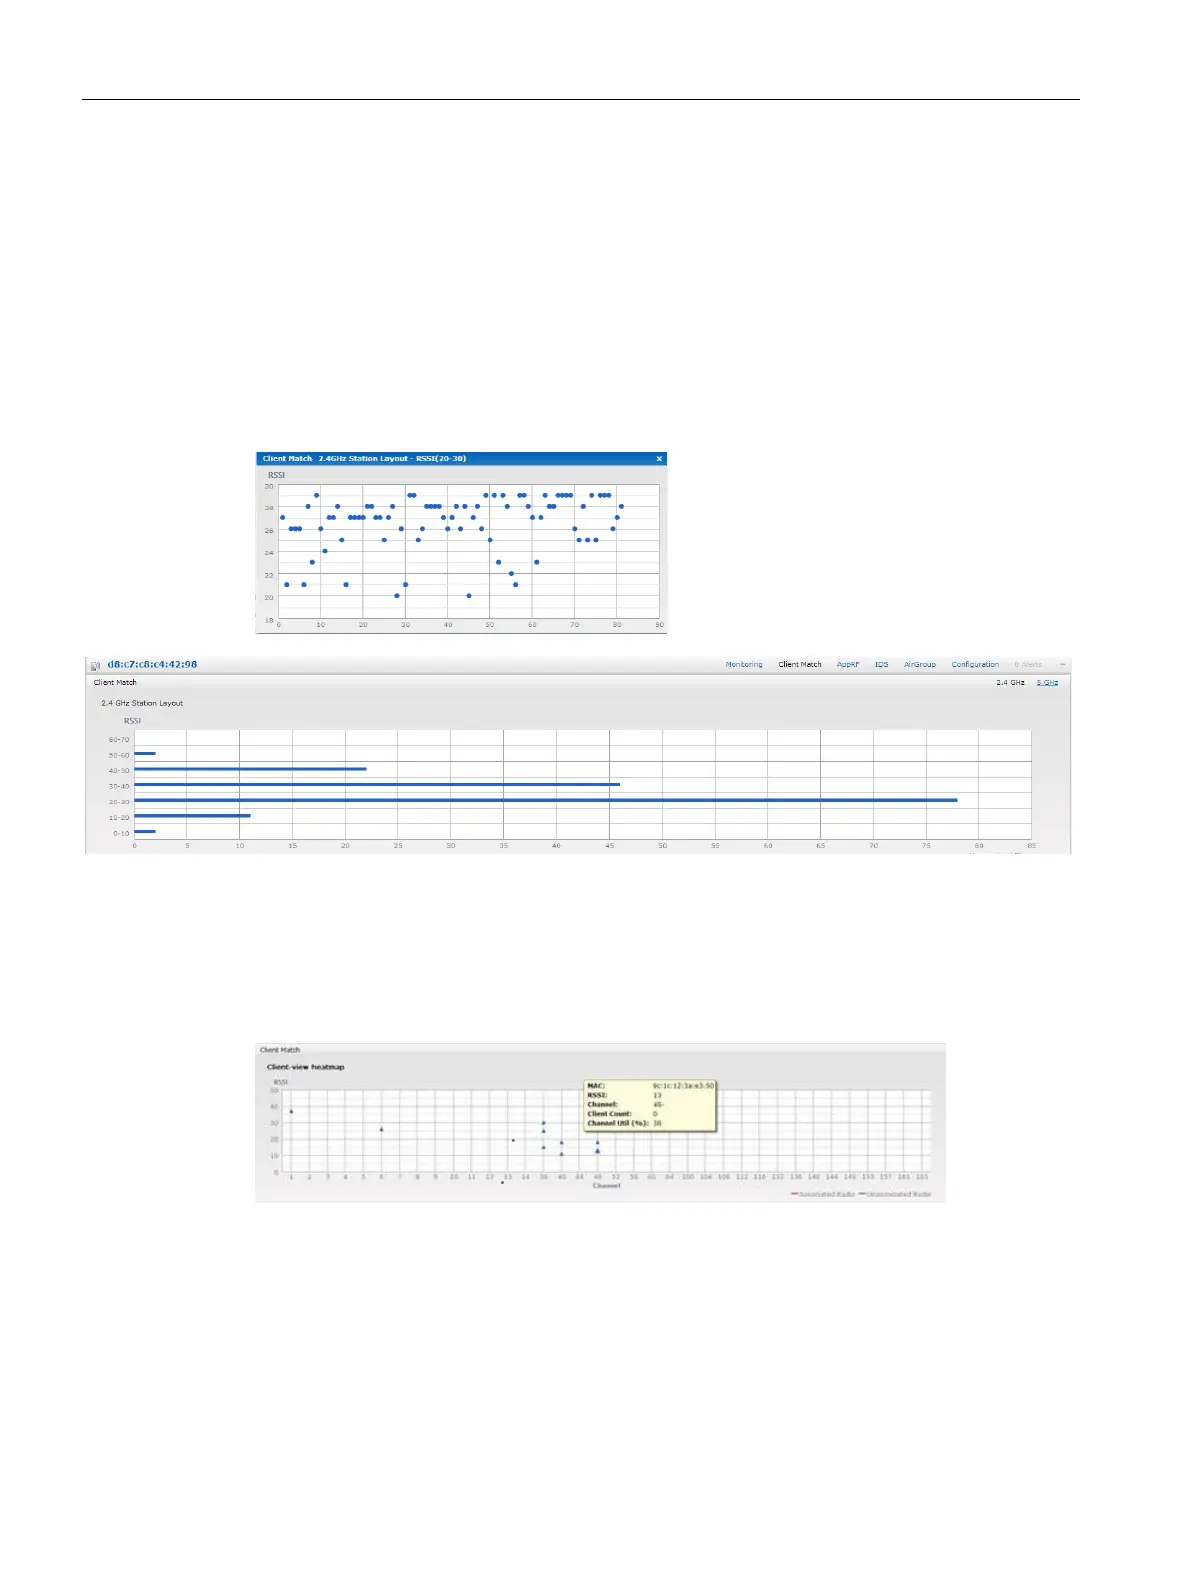
On clicking a client in the
tab and the
link, a graph is drawn with real-
time data points for an AP radio map. When you hover the mouse on the graph, details such
as RSSI, channel utilization details, and client count on each channel are displayed.
The following figure shows the client view heat map for an AP radio:
Figure 6-14 Channel Availability Map for Clients
 Loading...