Analyst 5
Agilent Nano Indenter G200 User’s Guide 5-10
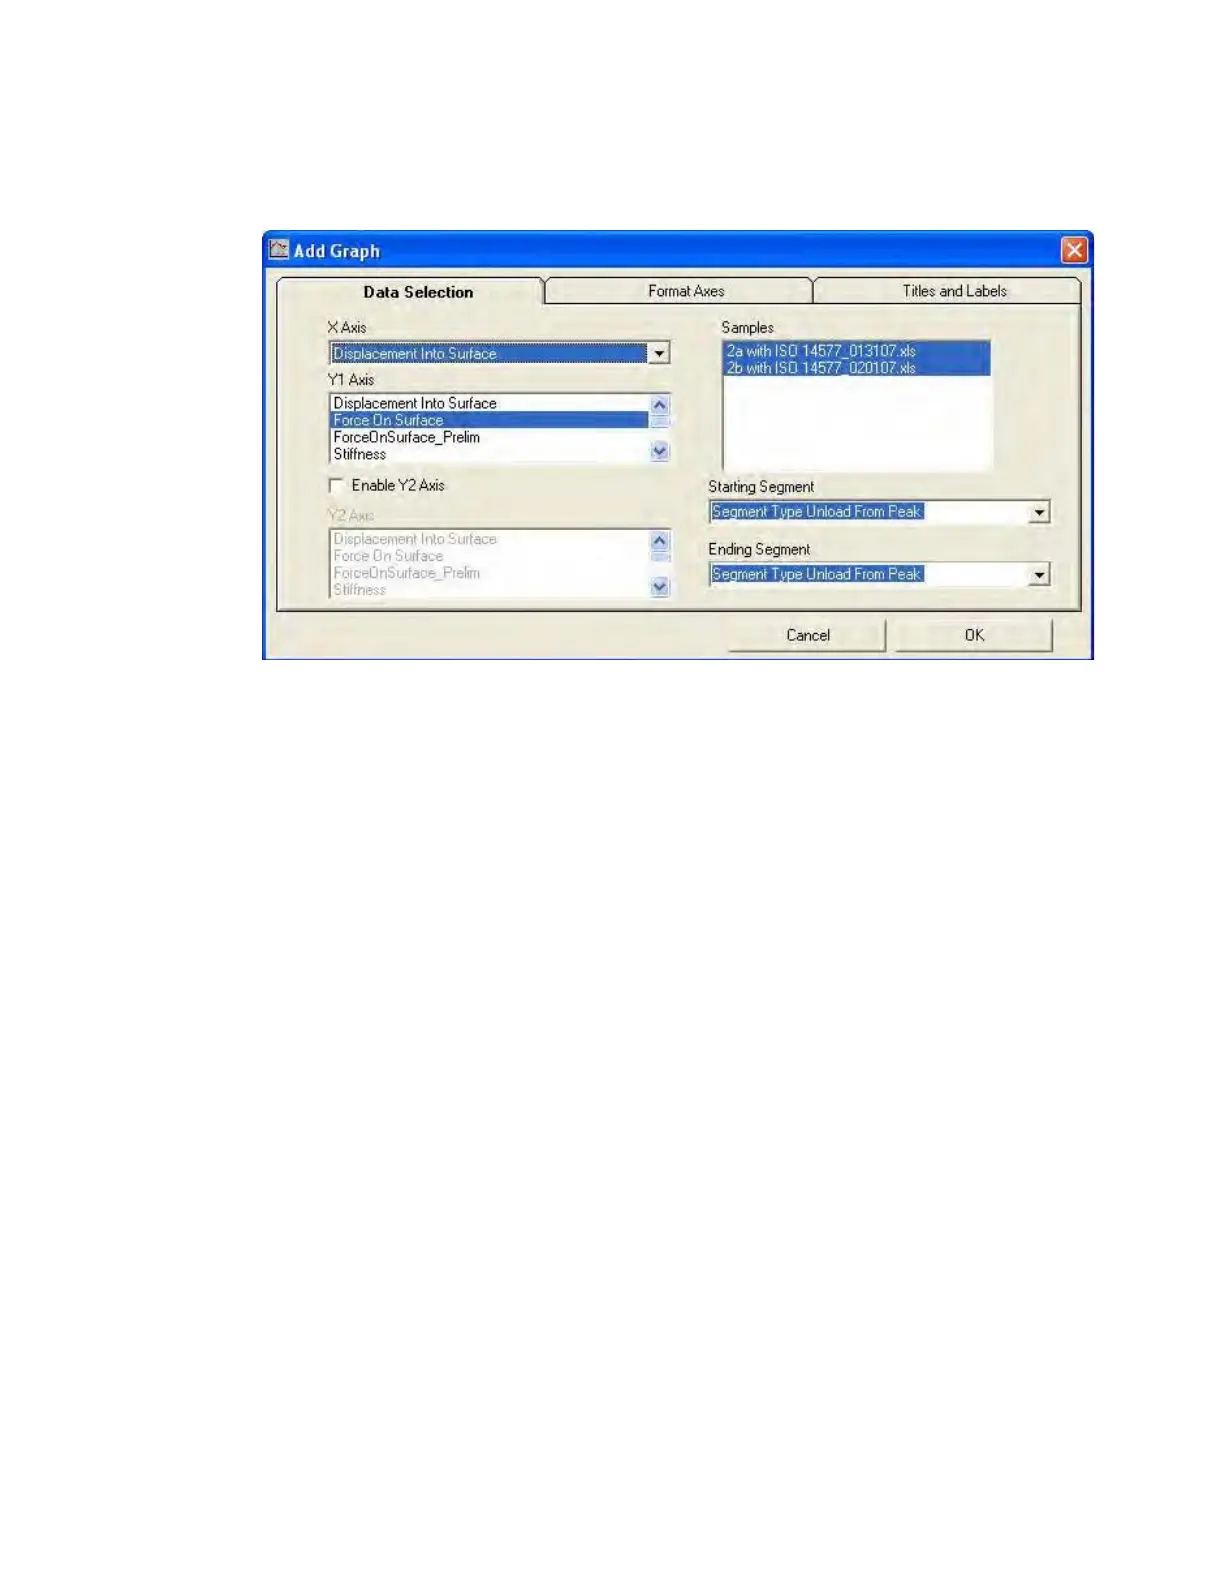
Figure 5-7Data Select tab for a graph
Data Selection
If a graph is displayed in the View pane, then select which channels to
display on the X and Y axes in the drop-down menus under the labels
X
Axis and Y1 Axis.
Y1 indicates the first of two possible Y axes. To enable the second Y
axis, select the Enable Y2 Axis check box. The graph will then display
two Y axes, one to the left and one to the right. Clear the check box to
display only one Y axis.
Under the Samples label, you can select which samples that you want to
display.
The Starting Segment and Ending Segment drop-down menus enable
you to specify which segments of the test are displayed on the graph
(such as approach, loading, and unloading segments).
If a chart is displayed in the View pane, then select the results and
samples to be included in the bar chart as shown in
Figure 5-8 on
page 5-11.
 Loading...