Analyst 5
Agilent Nano Indenter G200 User’s Guide 5-18
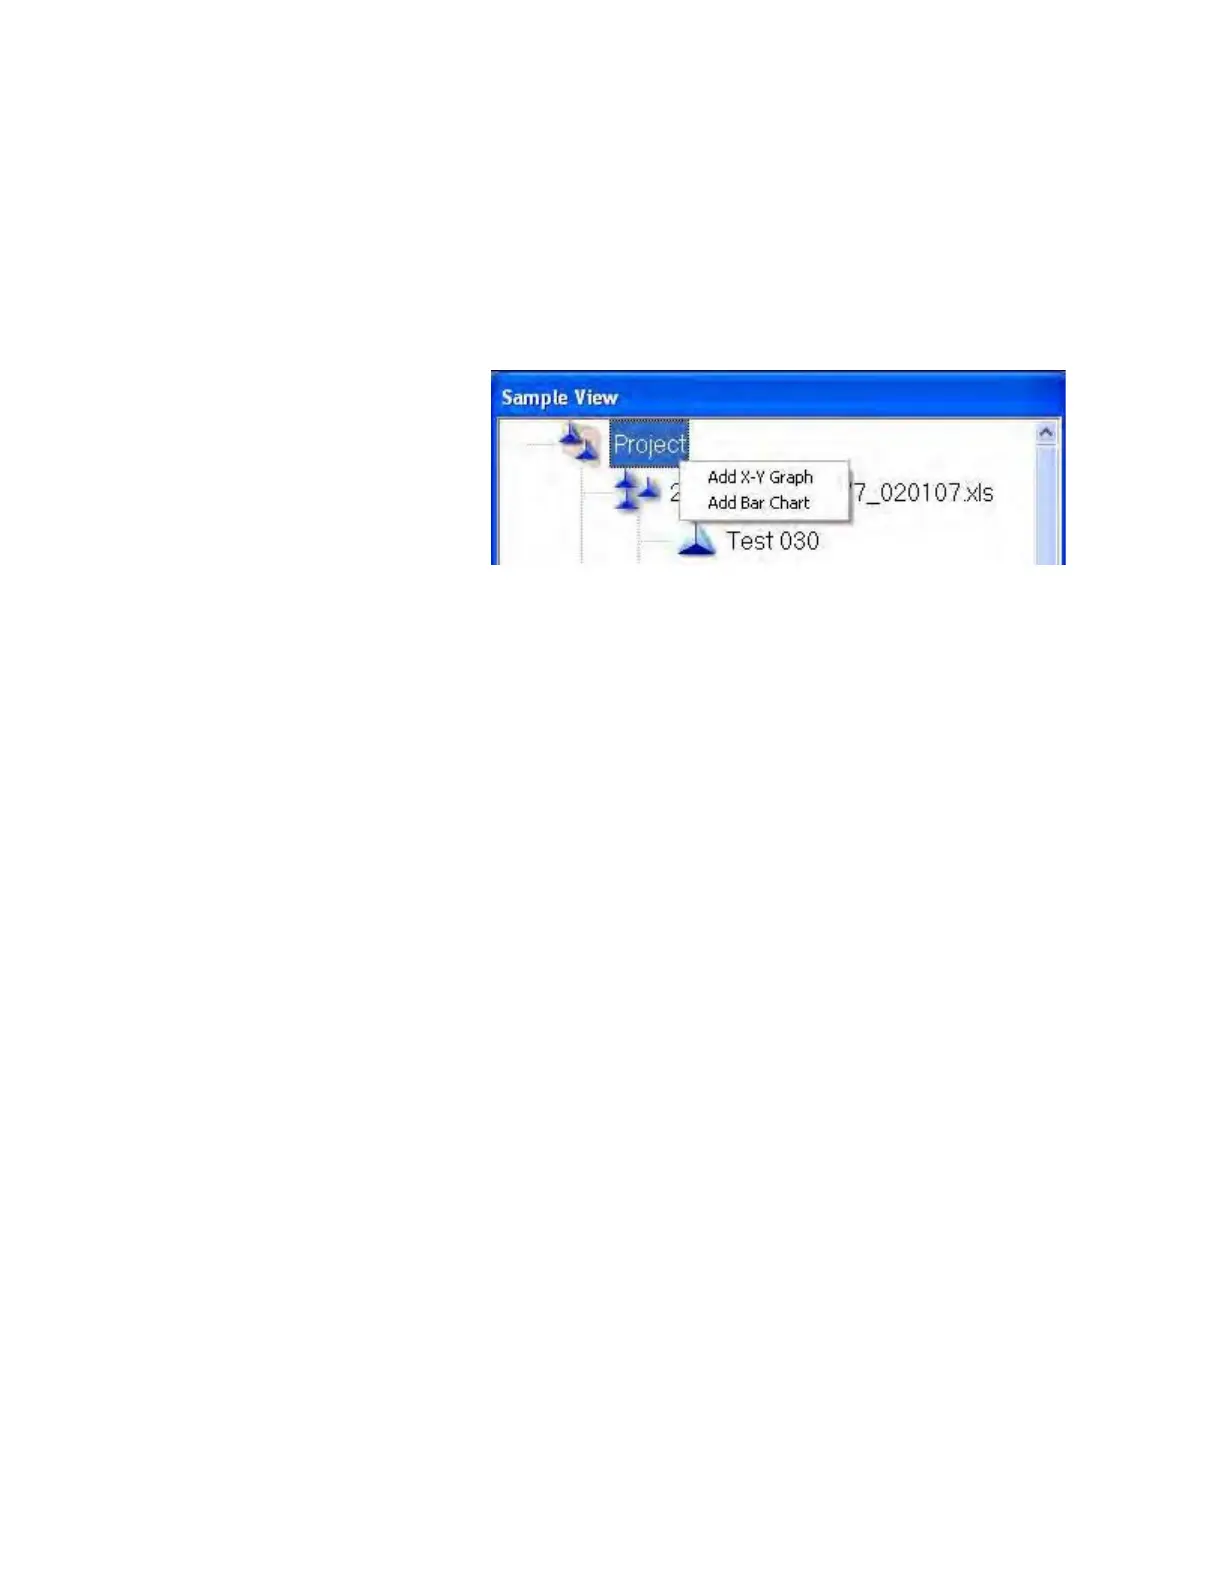
Project Level
Right-clicking on the title of the current project reveals a pop-up menu
as shown in
Figure 5-17. The commands here enable you to create either
a graph or bar chart that compares multiple samples within the project.
Figure 5-17Project level right-click menu
The Add X-Y Graph command invokes the Add Graph dialog box.
This dialog box enables you specify a graph to add to the View pane.
See
"Edit Graph" on page 5-9 for more information about the settings
available in this dialog box.
Once you specify the settings of the graph, click OK. The graph of
channels appears in the View pane.
The Add Bar Chart command invokes the Add Bar Chart dialog box.
This dialog box enables you to specify a bar chart to add to the View
pane. See
"Edit Graph" on page 5-9 for more information about the
settings available in this dialog box.
Once you specify the settings of the bar chart, click OK. The bar chart
of results appears in the View pane.
Note that if you do not select samples from the Samples list, Analyst
will include all samples in the graph or bar chart.
 Loading...