Analyst 5
Agilent Nano Indenter G200 User’s Guide 5-21
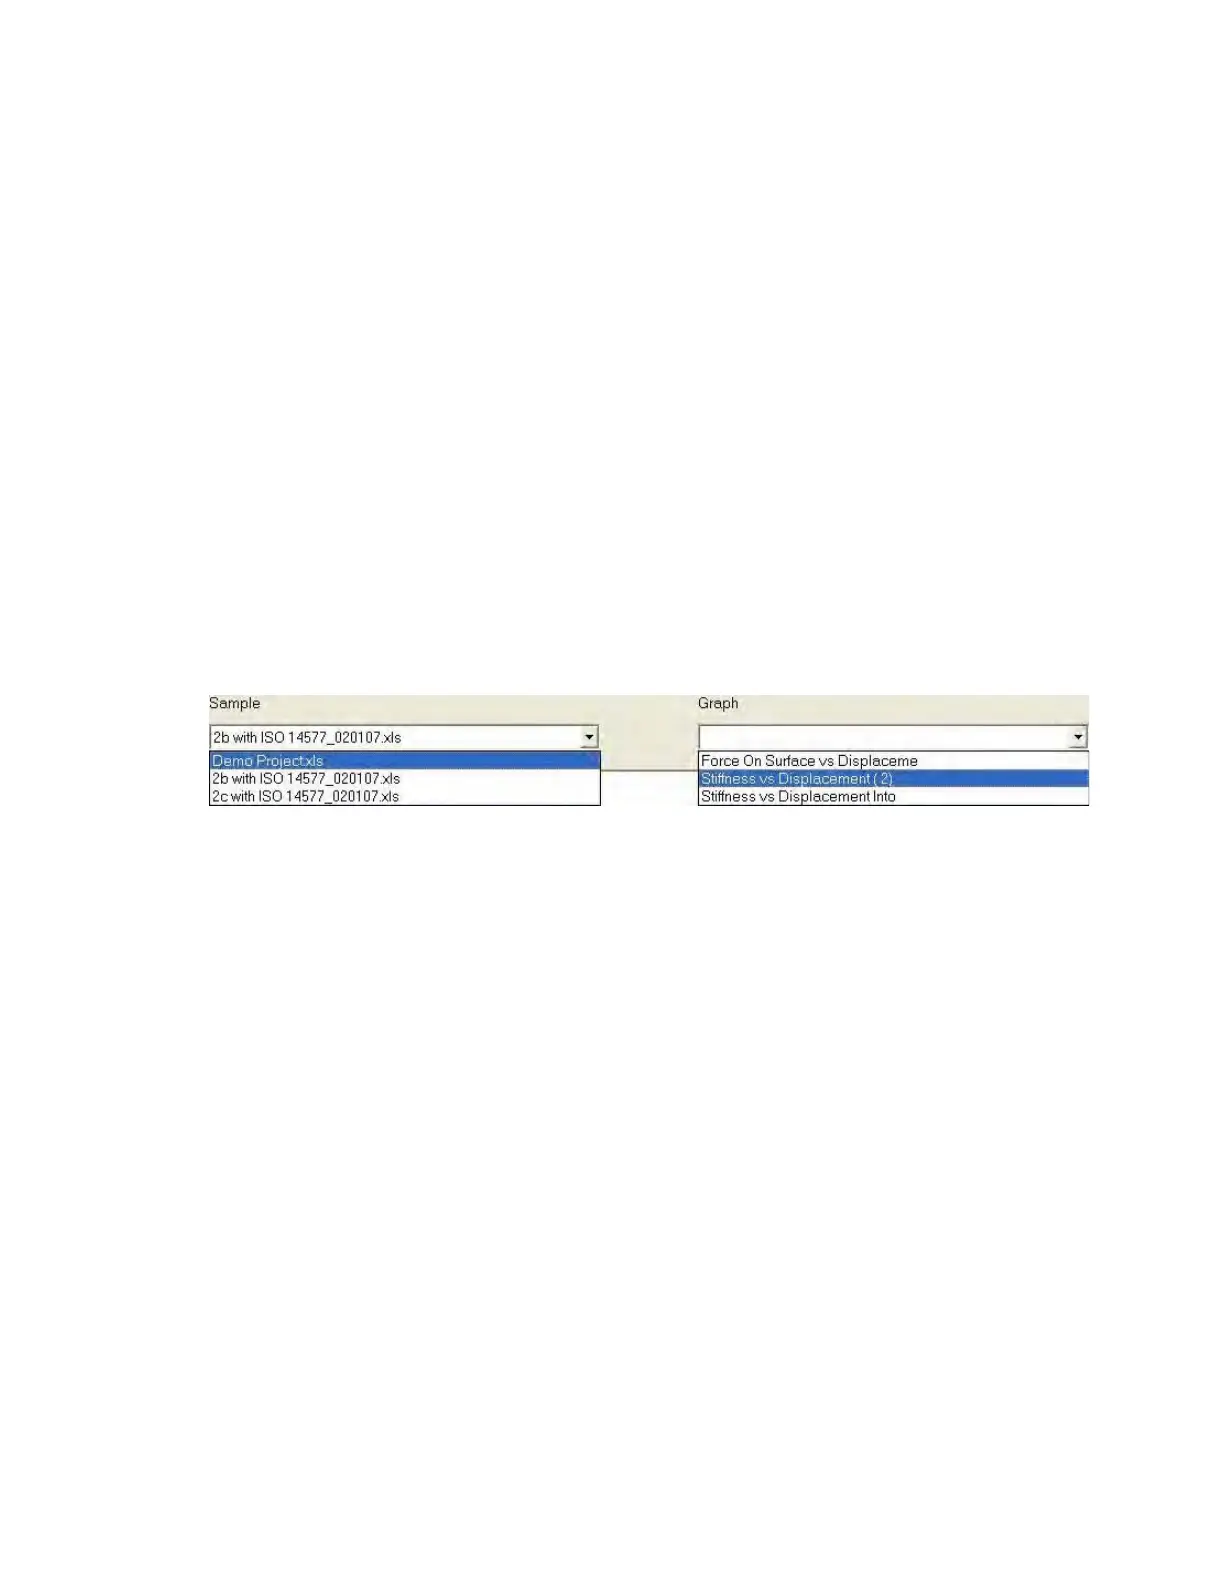
View Pane
This pane displays a graph or bar chart for the current project or a
sample within the current project. The item displayed in this pane can be
selected from the Sample and Graph drop-down menus. The items in
the Graph drop-down menu depend upon the selection in the Sample
drop-down menu.
If you select a project from the Sample drop-down menu, then the
Graph drop-down menu displays all of the graphs that have been
created for the project and are stored in the Excel workbook for the
project.
If you select a sample from the Sample drop-down menu, then the
Graph drop-down menu displays all of the graphs that have been
created for that particular sample and are stored in the Excel workbook
for that particular sample.
Figure 5-20Sample and Graph menus for View pane
The right-click menu for the View pane is a like the Edit menu, which
enables you to print, copy, edit, or delete a graph or chart.
 Loading...