Analyst 5
Agilent Nano Indenter G200 User’s Guide 5-19
Sample Level
Only one item is available on the Sample level right-click menu:
Add
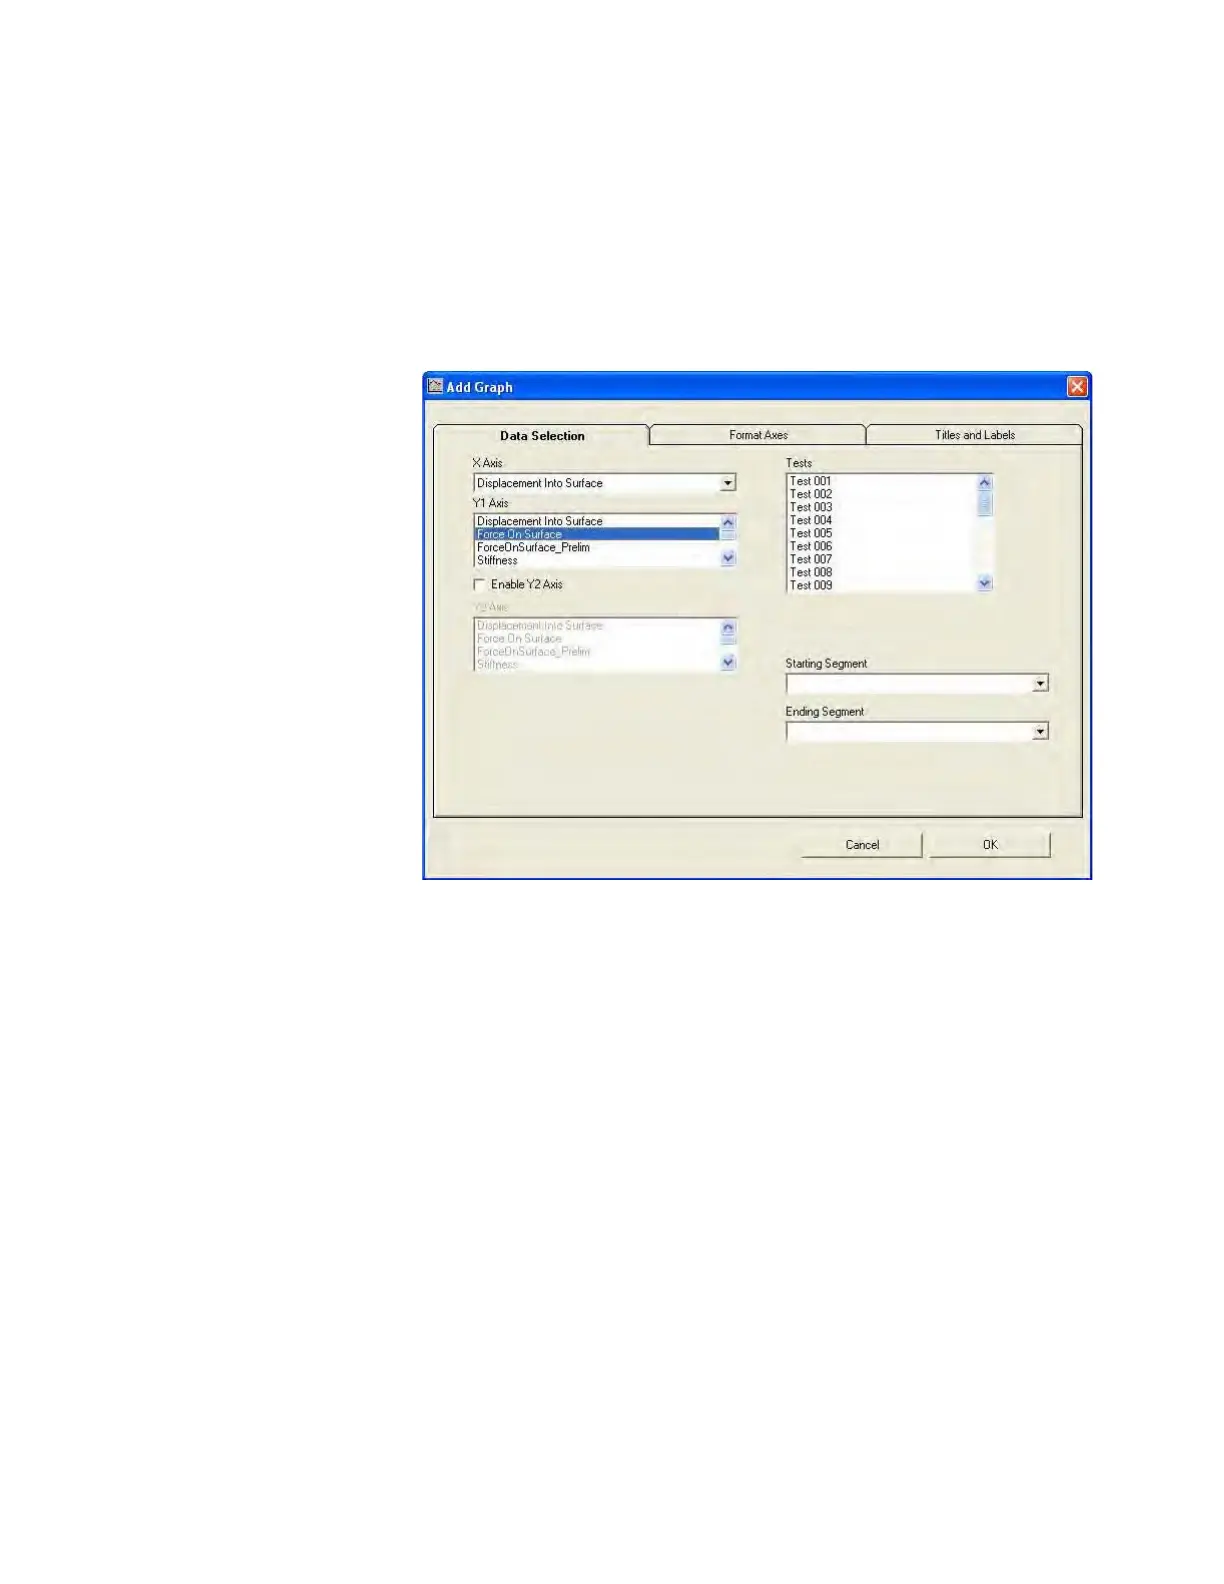
X-Y Graph. This command opens a dialog box to create a graph
that compares multiple tests within a sample, as shown in
Figure 5-18.
Figure 5-18Add Graph dialog box to compare multiple tests
The Add X-Y Graph command invokes the Add Graph dialog box that
is identical to the dialog box for the Add Graph command at the project
level except for the
Data Selection tab. At the Sample level, this tab
enables you to select tests instead of samples. See "Edit Graph" on
page 5-9 for more information about the settings available in this dialog
box.
Note that if you do not select tests from the Tests list, Analyst will
include all tests in the graph.
 Loading...