F6000 Family of Power System Simulators User Guide
72A-1589 Rev. C 02/01 4-9
D
DD
D
R
RR
R
A
AA
A
F
FF
F
T
TT
T
3
33
3
/
//
/
5
55
5
/
//
/0
00
0
1
11
1
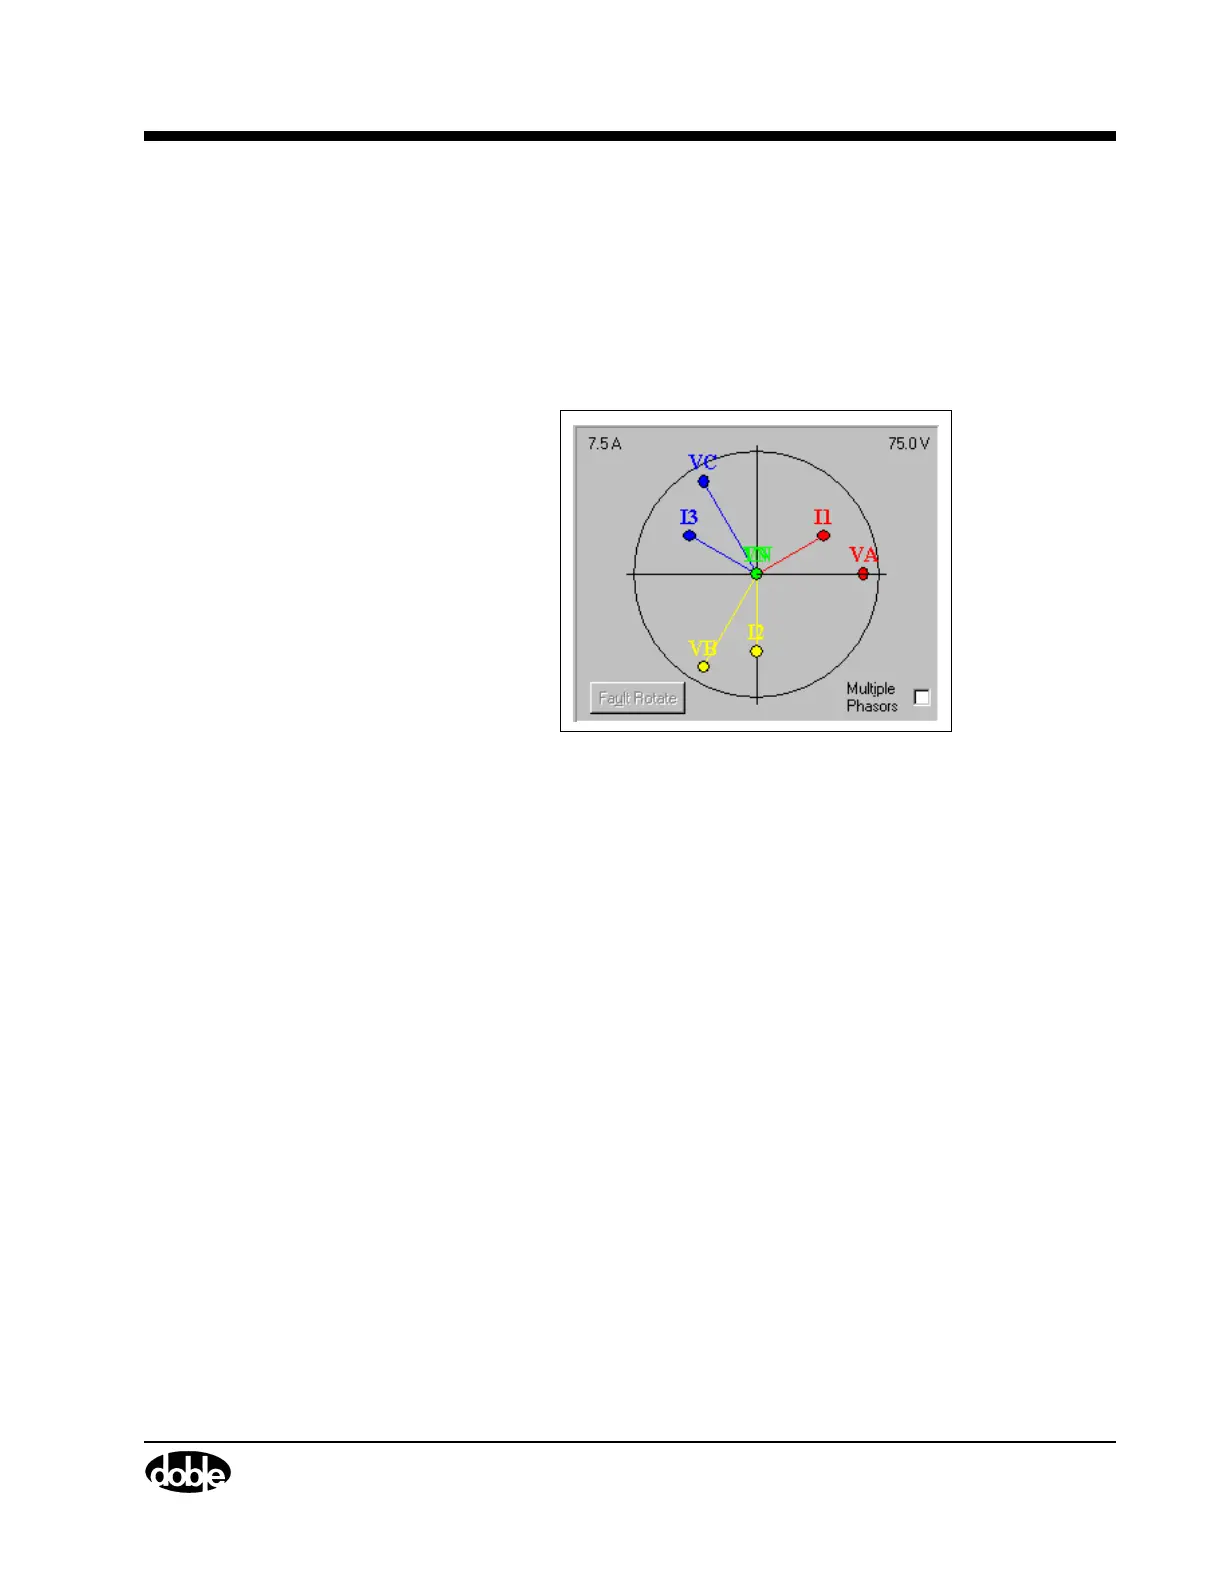
The phasor diagram gives a visual representation of the amplitude and
phase values in the source table. The source table and phasor diagram
interact with each other. Source table values are continuously updated as
phasors are dragged to new locations in the diagram using the mouse,
but the change is not sent to the F6000 Instrument until the phasor is
dropped.
Figure 4.4 Phasor Diagram
Range Settings
The upper left-hand corner of the phasor diagram contains the highest
current setting from the Range column of the source table. The upper
right-hand corner of the phasor diagram contains the highest voltage
setting from the Range column of the source table.
These settings determine the scale of the phasor diagram. For example,
if the amplitude for current source I1 is 15 A and the highest range setting
for the current sources is 15 A, the I1 phasor reaches to the perimeter of
the circle in the phasor diagram. Similarly, if the potential for voltage
source VA is 50 V and the highest range setting for the voltage sources is
75 V, the length of the VA phasor is two-thirds the radius of the circle in
the phasor diagram.