107
────────────────────────────────────────────────────
7.4 Taking Measurements
────────────────────────────────────────────────────
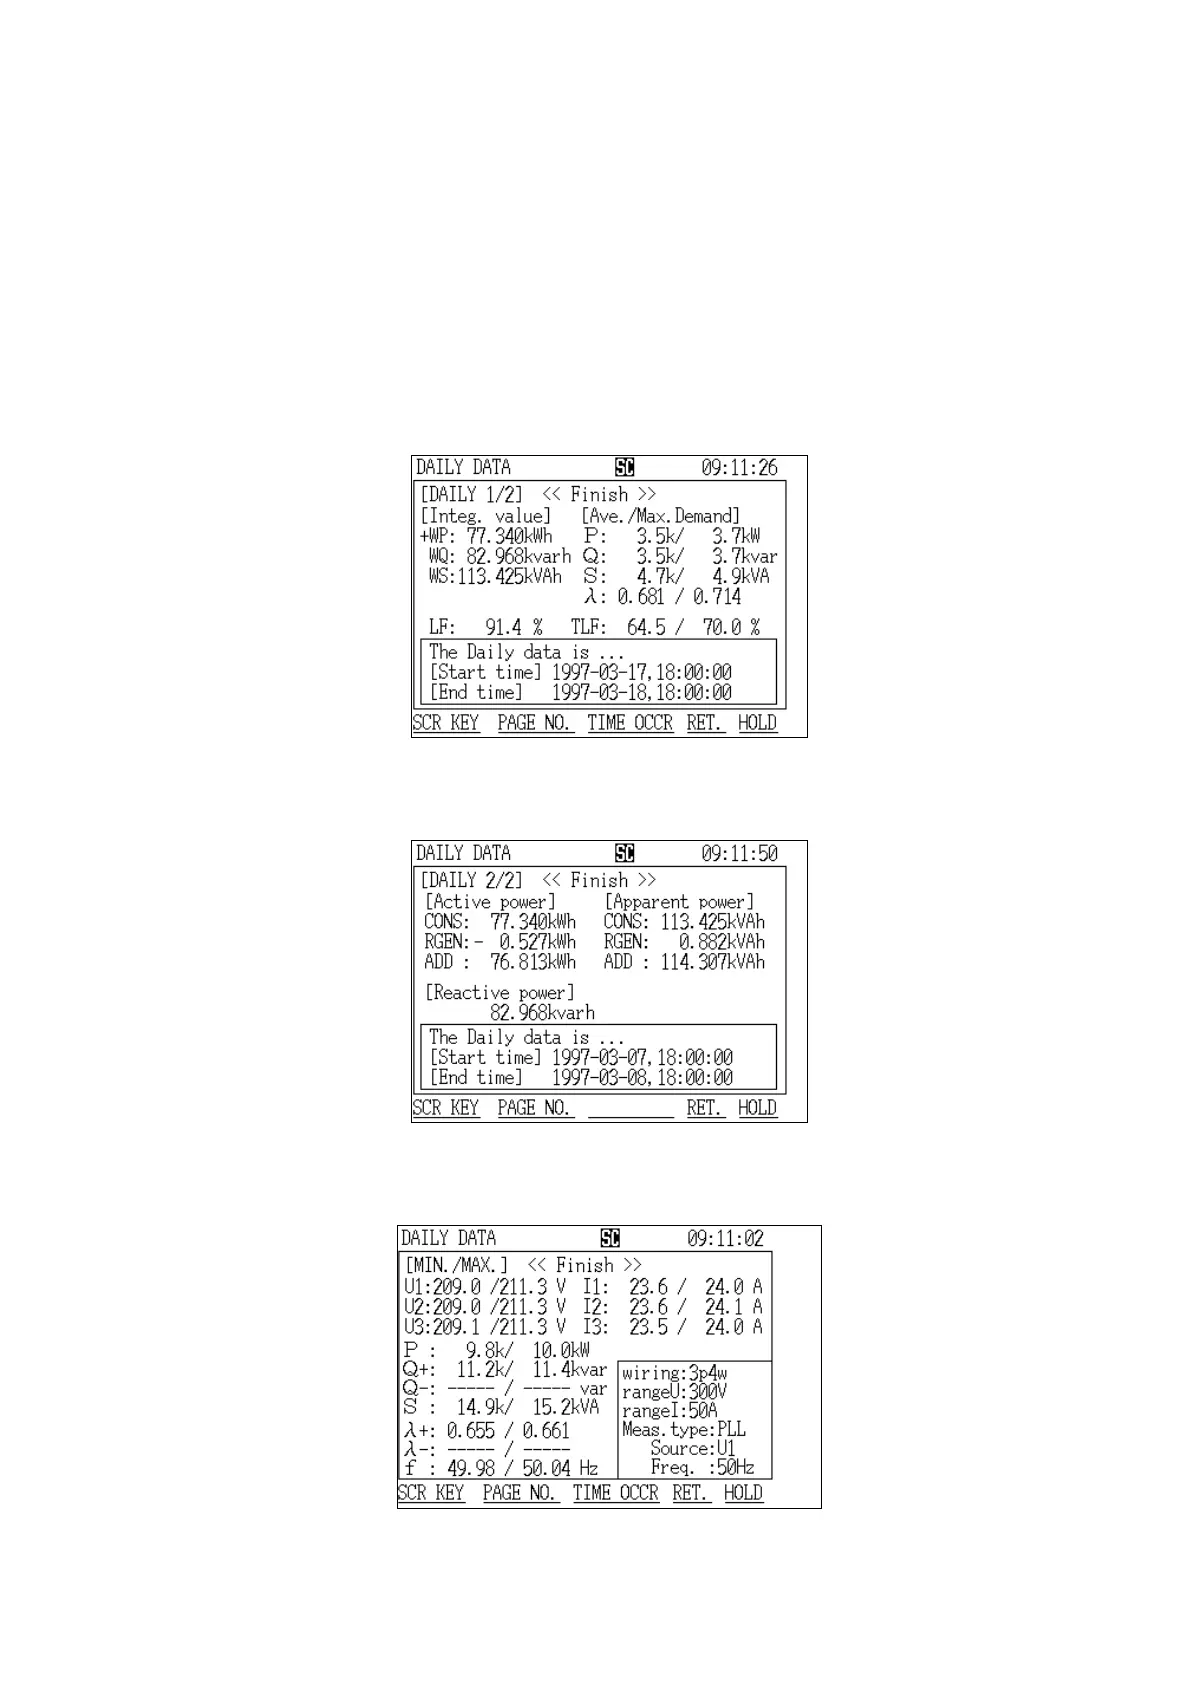
Daily Report Screen (page 1/2)
Daily Report Screen (page 2/2)
Daily Report Minimum/Maximum Screen
This display consists of the following three screens:
"Daily Report" screen page 1/2 displays measured values and maximum
demand values concerning power consumption.
"Daily Report" screen page 2/2 displays measured values concerning power
flows, such as consumption/regeneration.
The "Minimum/Maximum Values" screen displays the minimum/maximum
instantaneous values for a one-day period.
Select each screen in the same manner as described in section 7.4.5,
"Displaying Integrated Values."
(1) Displaying the "Daily Report" screen (page 1/2)
(2) Displaying the "Daily Report" screen (page 2/2)
(3) Displaying the "Maximum/Minimum" screen