105
────────────────────────────────────────────────────
7.4 Taking Measurements
────────────────────────────────────────────────────
.4.6 Displaying Demand Values
NOTE
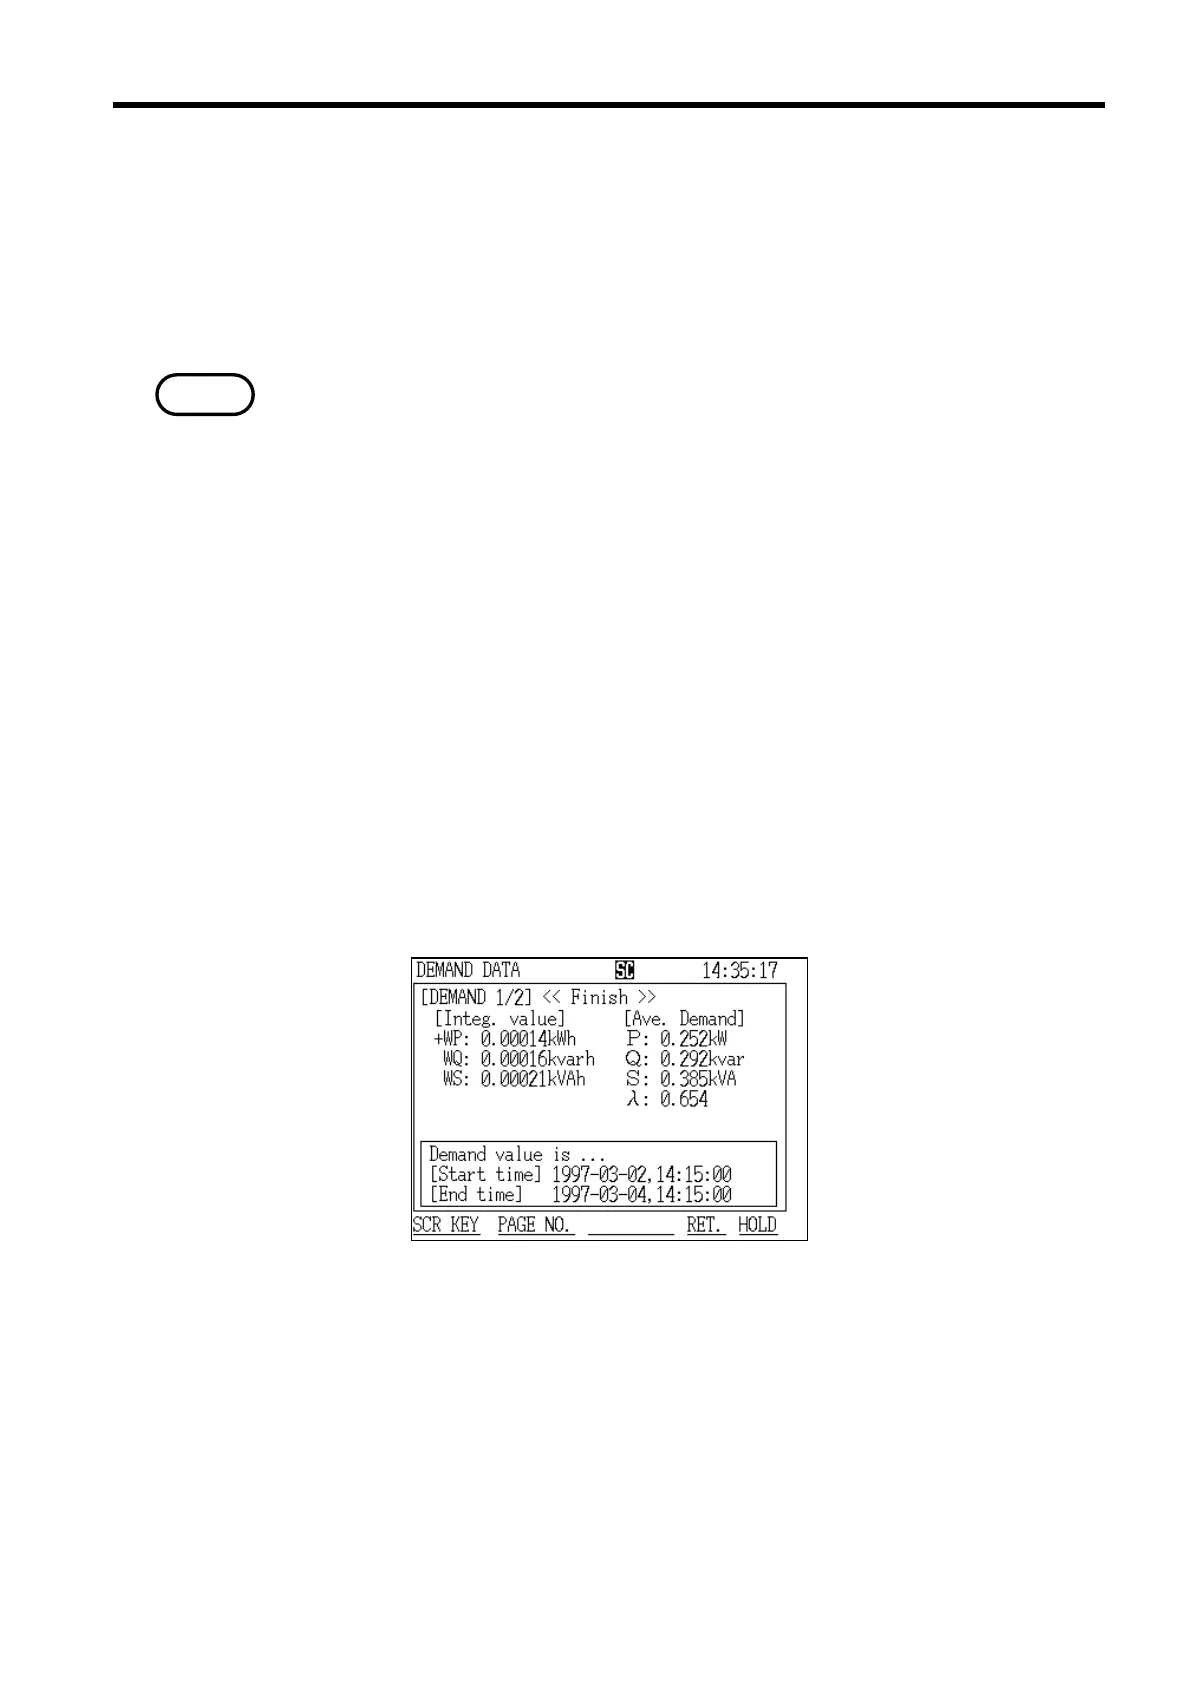
Demand Screen (page 1/2)
The screen that displays the demand values shows the measurement results
for power levels, etc., for each demand period.
The measurement results that are displayed on the demand display screen are
the results for the demand measurement period preceding the current demand
measurement period.
・Measurement results are not displayed until the first demand measurement
period passes.
・Once the current demand measurement period passes, the old demand data is
cleared and replaced with the new demand data.
・Use automatic output to a printer or floppy disk in order to keep a record of
demand data.
This display consists of the following three screens:
"Demand" screen page 1/2 displays measured values concerning power
consumption.
"Demand" screen page 2/2 displays measured values concerning power flows,
such as consumption/regeneration.
The "Minimum/Maximum Values" screen displays the minimum/maximum
instantaneous values for each demand period.
Select each screen in the same manner as described in section 7.4.5,
"Displaying Integrated Values."
(1) Displaying the "Demand" screen (page 1/2)