110
────────────────────────────────────────────────────
7.4 Taking Measurements
────────────────────────────────────────────────────
.4.9 Displaying Monthly Reports
NOTE
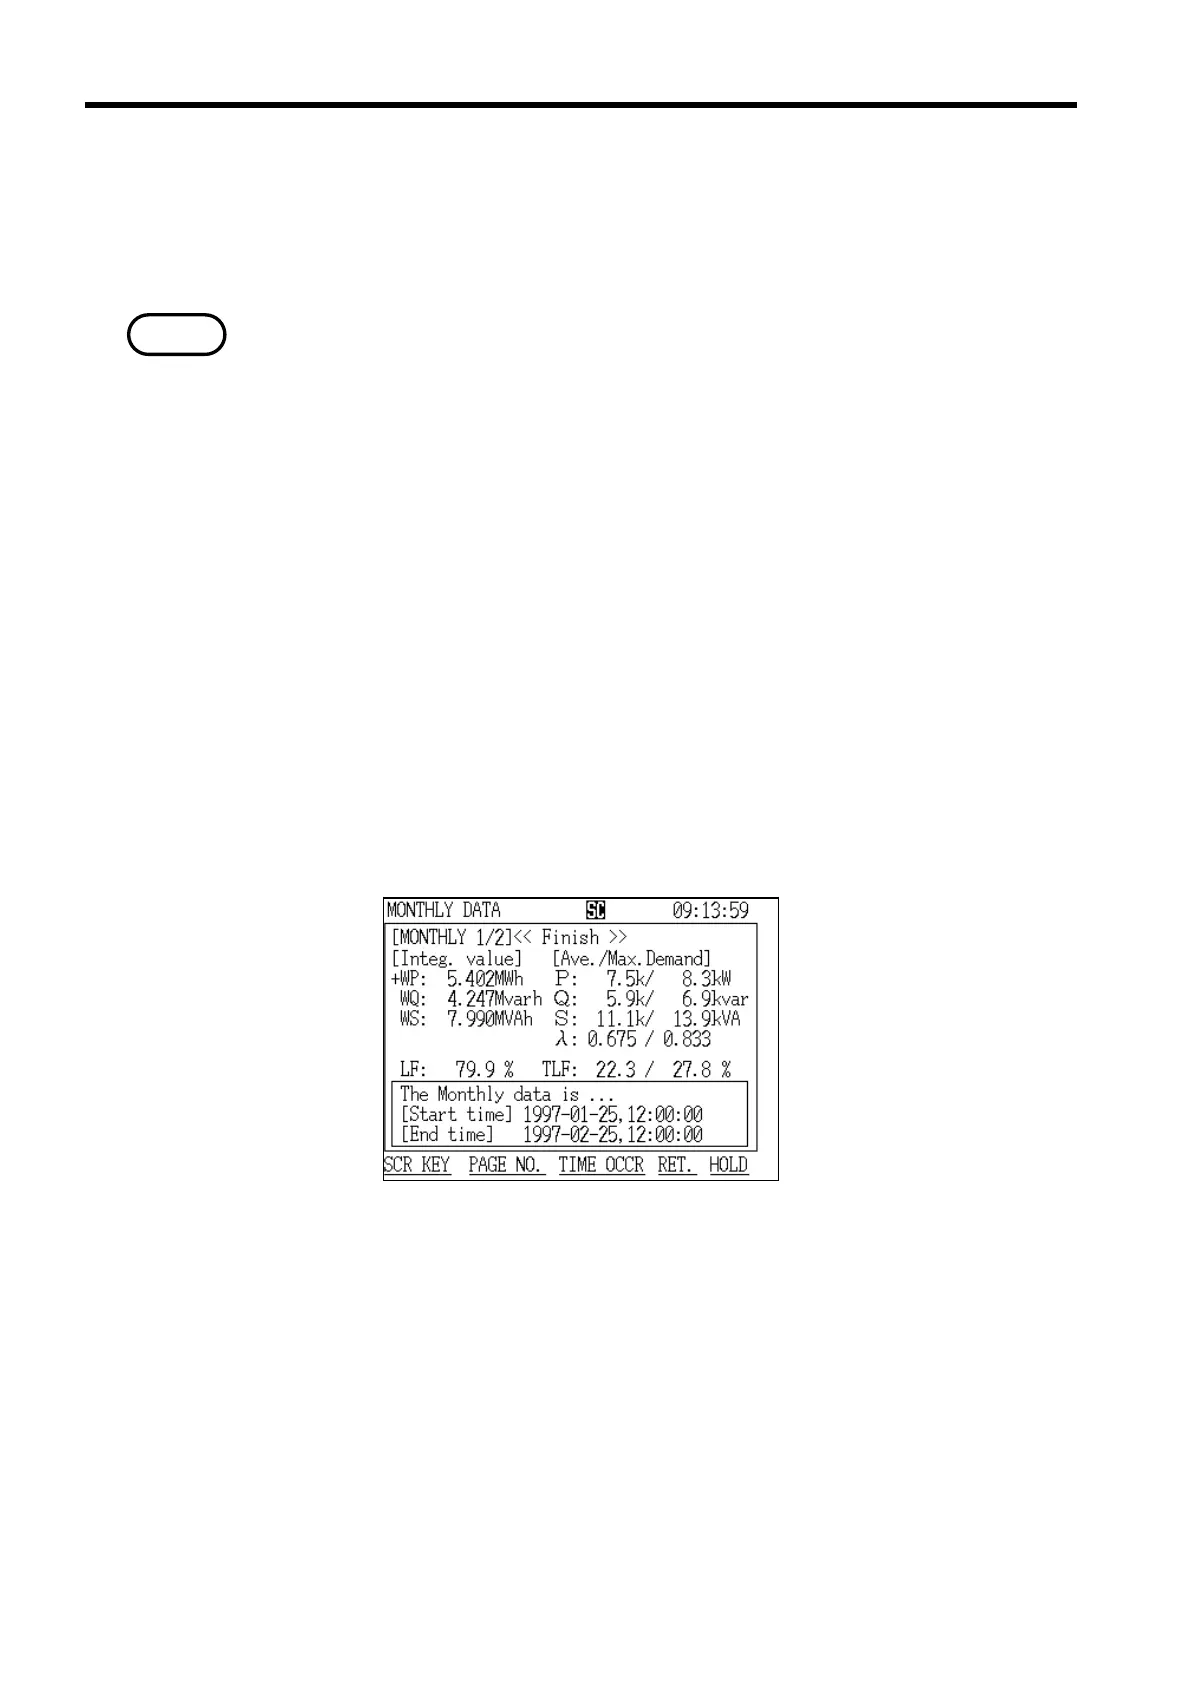
Monthly Report Screen (page 1/2)
The screen that displays the monthly report shows the measurement results
for a one-month period (ending on the same numbered day of the next month)
since the demand start time.
・Measurement results are not displayed until at least one month of the
demand measurement period has passed.
・Once the current one-month period passes, the old demand data is cleared and
replaced with the new demand data.
・Use automatic output to a printer or floppy disk in order to keep a record of
monthly report data.
This display consists of the following three screens:
"Monthly Report" screen page 1/2 displays measured values and maximum
demand values concerning power consumption.
"Monthly Report" screen page 2/2 displays measured values concerning power
flows, such as consumption/regeneration.
The "Minimum/Maximum Values" screen displays the minimum/maximum
instantaneous values for a one-month period.
Select each screen in the same manner as described in section 7.4.5,
"Displaying Integrated Values."
(1) Displaying the "Monthly Report" screen (page 1/2)