252
────────────────────────────────────────────────────
13.3 Output Response Characteristics
────────────────────────────────────────────────────
NOTE
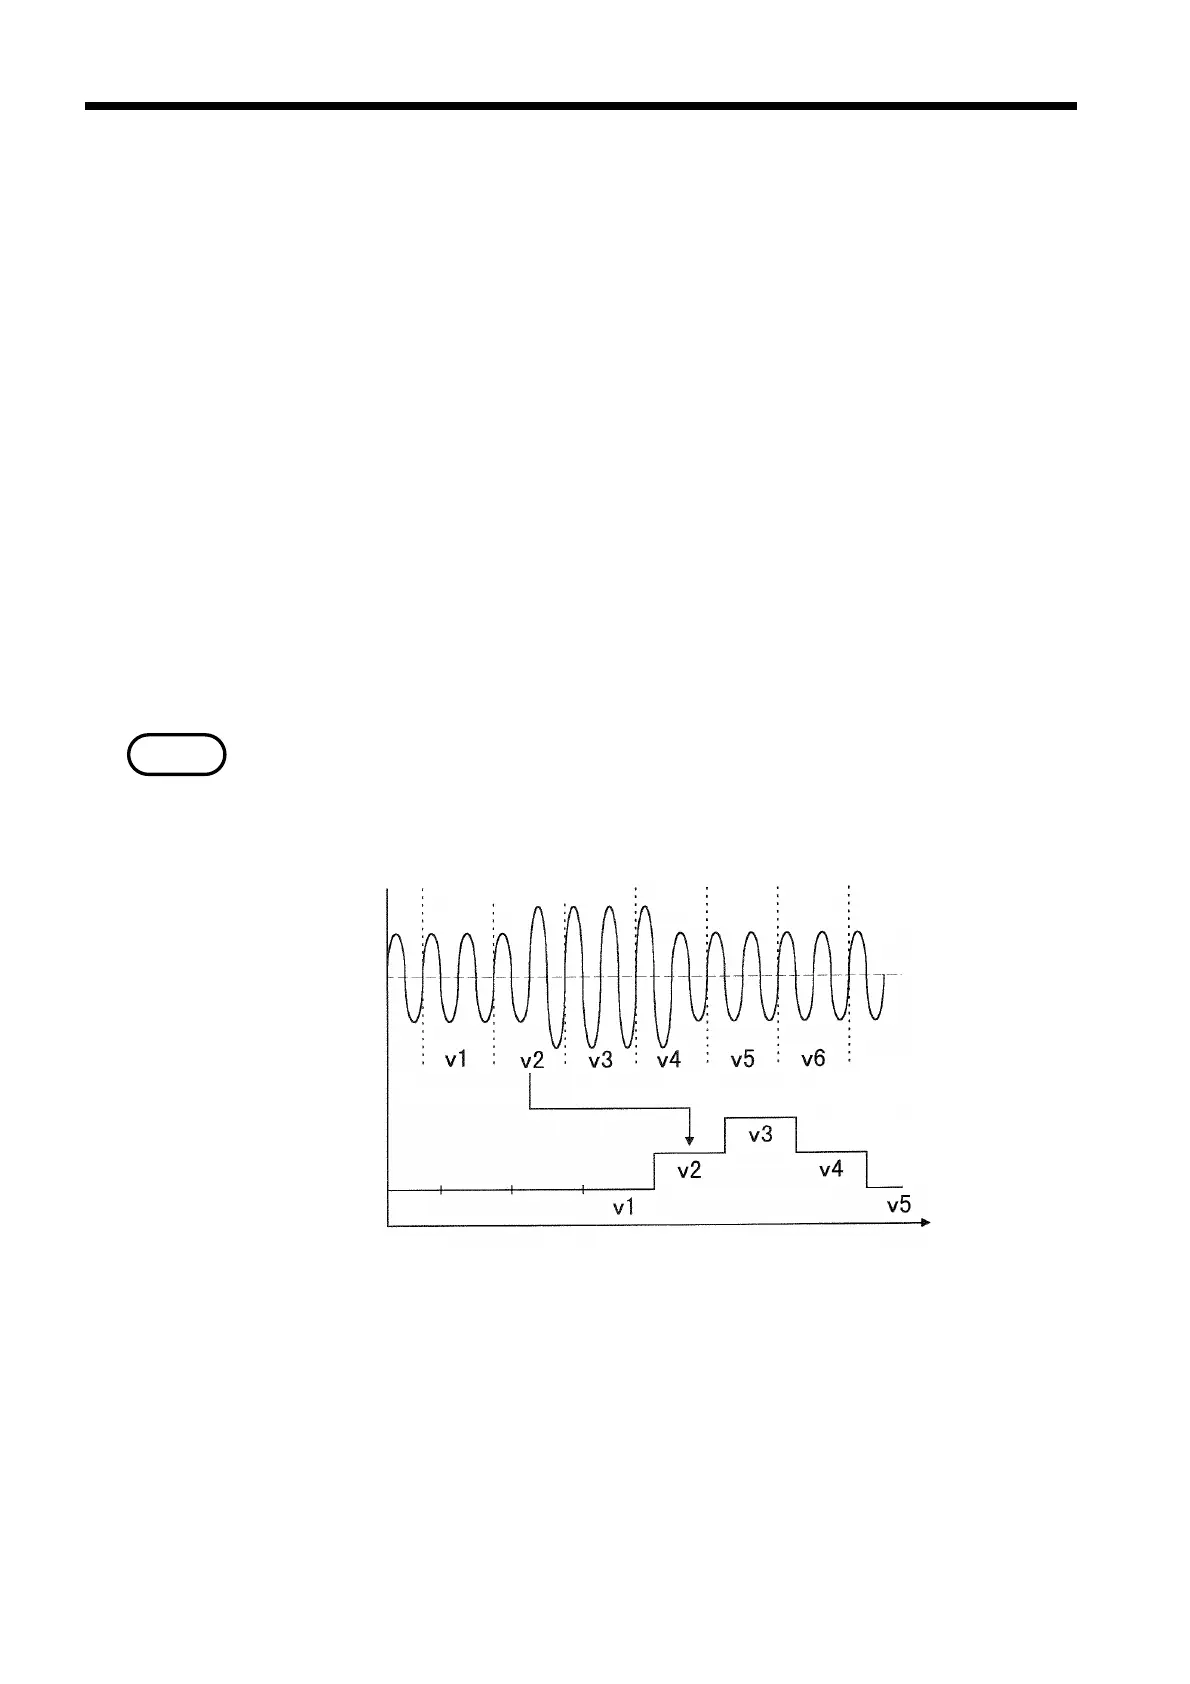
Operation lengt
(2 cycles)
Time
D/A
Outpu
Input
D/A Output Response Characteristics (1)
3.3 Output Response Characteristics
This power meter uses two cycles (when measuring at 50/60 Hz; 16 cycles
when measuring at 400 Hz) as one sample and takes measurements by
continuously performing various calculations on the data (without losing the
waveform). This data is displayed intermittently, depending on the display
update rate, as the instantaneous values. In contrast, in Normal
Measurement mode the D/A output continuously outputs all measurement
values as they are continuously measured.
Therefore, even transient changes in the input waveform generated by a power
spike, for example, will be faithfully output. The output response is different,
however, in Integrated Measurement or Demand Measurement mode.
(1) Normal Measurement mode
In this mode, the output is updated every two cycles when measuring at 50/60
Hz (50 Hz: about 40 ms; 60 Hz: about 34 ms) and every 16 cycles when
measuring at 400 Hz (about 34 ms).
Although the output update rate is every two or sixteen cycles, there may be a
delay of 3 to 4 cycles (or 24 to 32 cycles when measuring at 400 Hz) between
the input waveform and the actual output on the D/A output.