102
────────────────────────────────────────────────────
7.4 Taking Measurements
────────────────────────────────────────────────────
.4.5 Displaying Integrated Values
Load facto
Usage facto
Average value within a time period
and maximum demand value
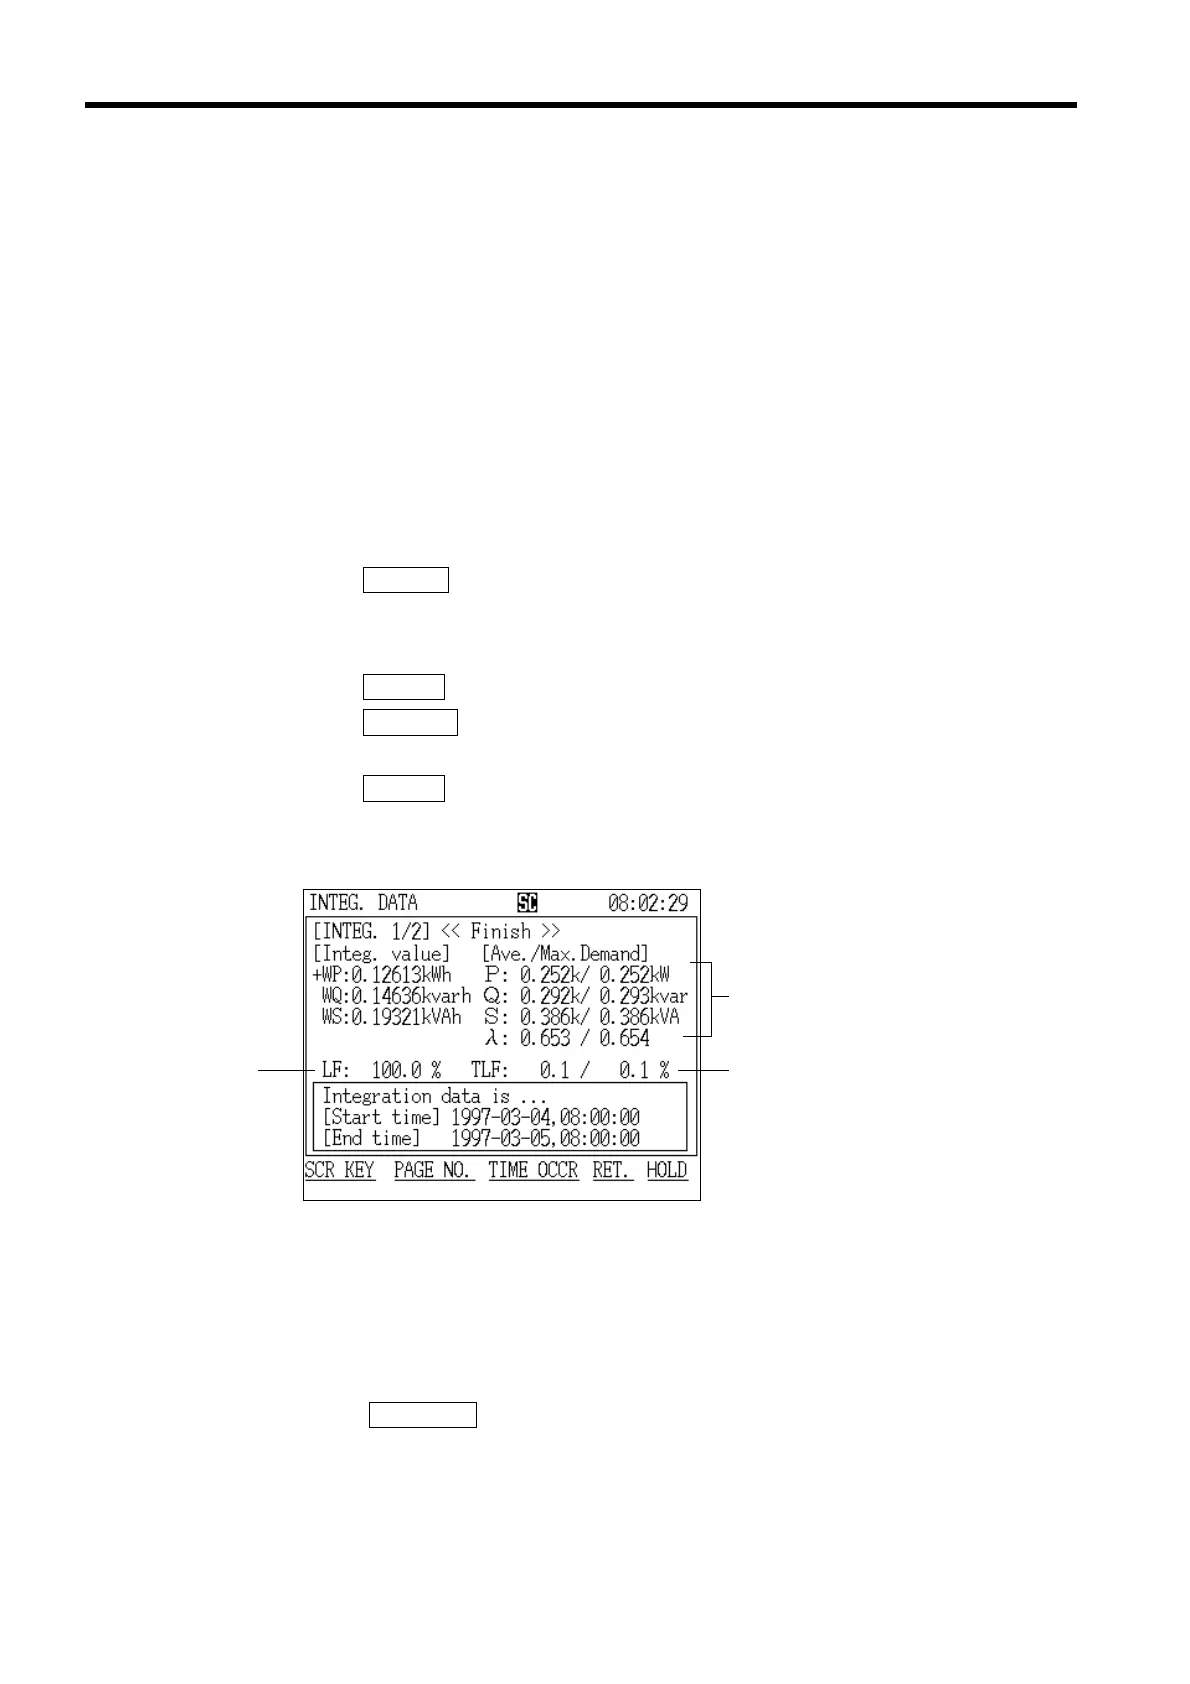
Integration Screen (page 1/2)
The screen that displays the integrated values shows the measurement results
from the start of demand measurement until the elapsed measurement time.
This display consists of the following three screens:
"Integration" screen page 1/2 displays measured values and the maximum
demand values concerning power consumption.
"Integration" screen page 2/2 displays measured values concerning power
flows, such as consumption/regeneration.
The "Minimum/Maximum Values" screen displays the minimum/maximum
instantaneous values from the start of demand measurement until the elapsed
measurement time.
(1) Displaying the "Integration" screen (page 1/2)
1. Press the
SCR.KEY function key.
2. The "Display Selection" window appears.
3. Position the cursor at "Integration (INTEG.)."
4. Press the
DETERM function key.
5. Press the
PAGE NO. function key and position the cursor on "Integration 1/2
(Integ.1/2)."
6. Press the
DETERM function key.
7. The "Integration" screen (page 1/2) is displayed.
●Displaying the time at which a maximum demand value was
generated
1. Press the TIME OCCR function key.
2. The "Generation Time" window is displayed.
3. Position the cursor on the measurement item for which you wish to see the
generation time.