108
────────────────────────────────────────────────────
7.4 Taking Measurements
────────────────────────────────────────────────────
.4.8 Displaying Weekly Reports
NOTE
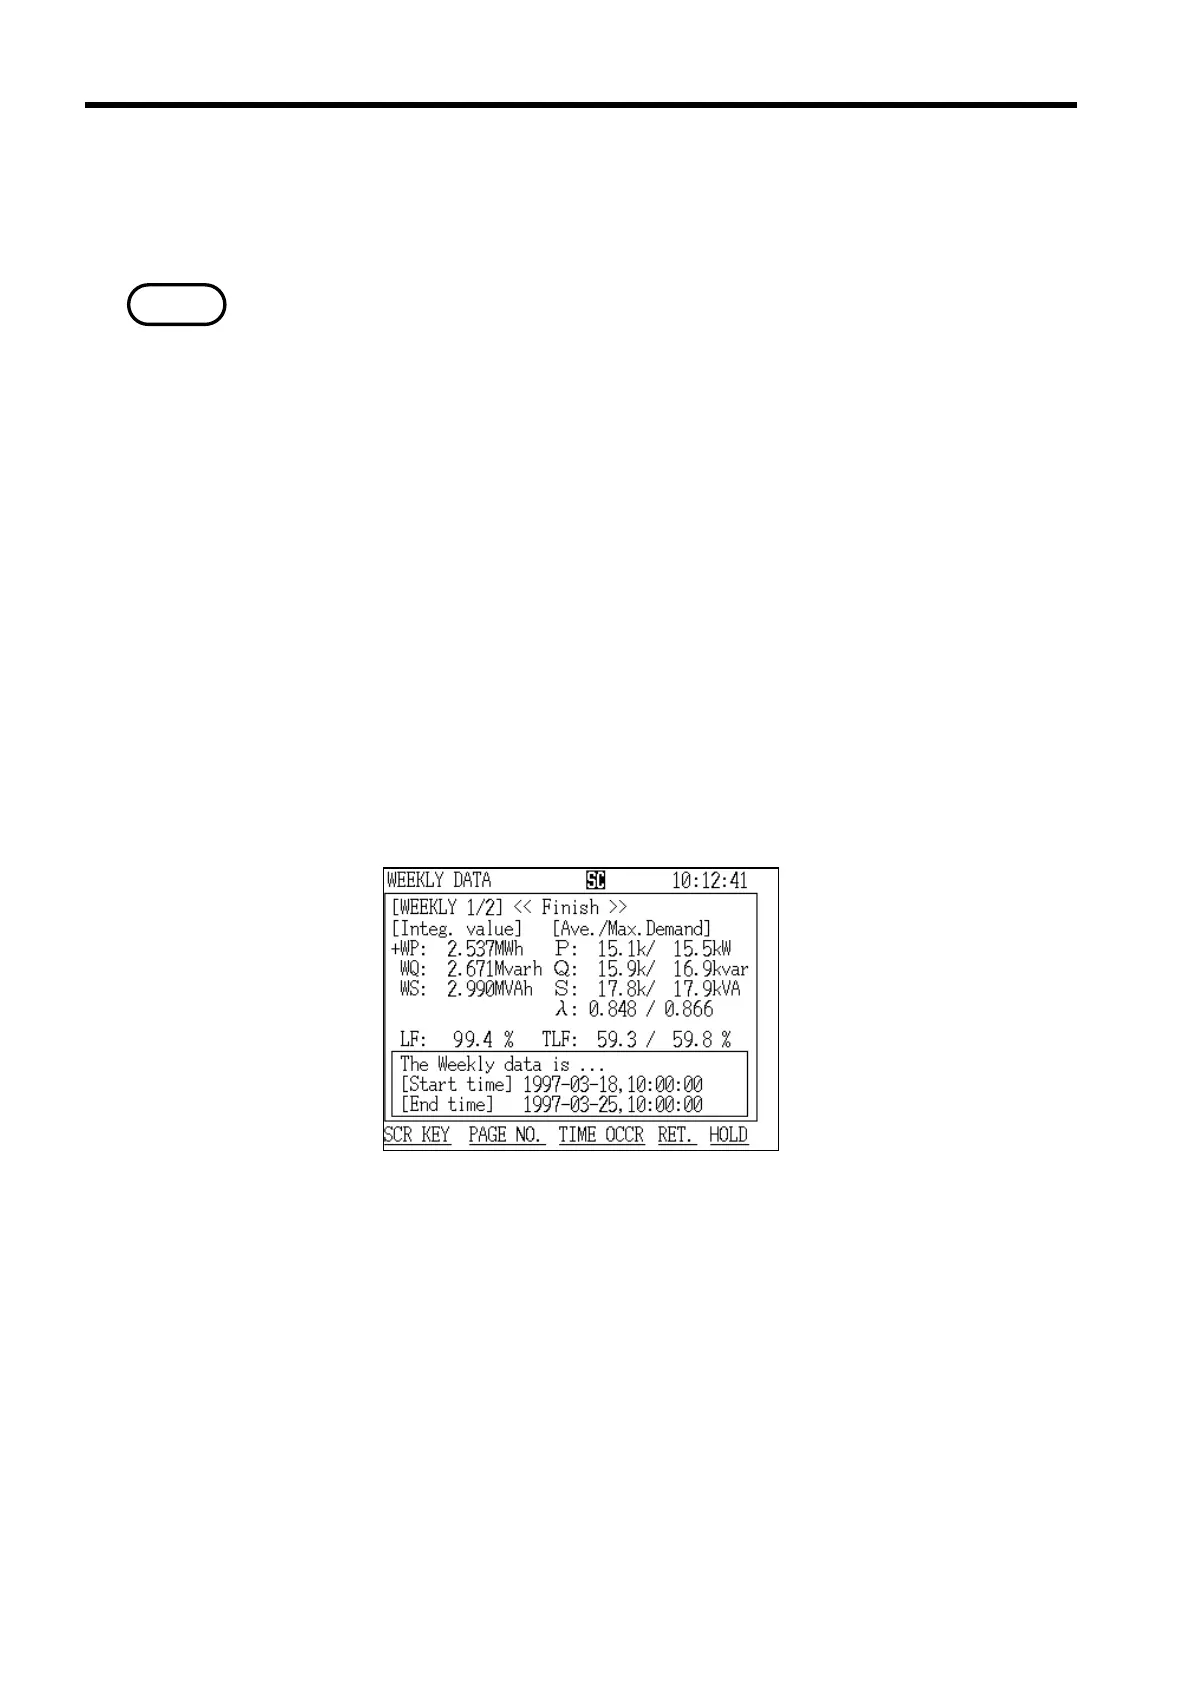
Weekly Report Screen (page 1/2)
The screen that displays the weekly report shows the measurement results for
a one-week (7-day) period since the demand start time.
・Measurement results are not displayed until at least one week of the demand
measurement period has passed.
・Once the current one-week period passes, the old demand data is cleared and
replaced with the new demand data.
・Use automatic output to a printer or floppy disk in order to keep a record of
weekly report data.
This display consists of the following three screens:
"Weekly Report" screen page 1/2 displays measured values and maximum
demand values concerning power consumption.
"Weekly Report" screen page 2/2 displays measured values concerning power
flows, such as consumption/regeneration.
The "Minimum/Maximum Values" screen displays the minimum/maximum
instantaneous values for a one-week period.
Select each screen in the same manner as described in section 7.4.5,
"Displaying Integrated Values."
(1) Displaying the "Weekly Report" screen (page 1/2)