75
────────────────────────────────────────────────────
6.4 Taking Measurements
────────────────────────────────────────────────────
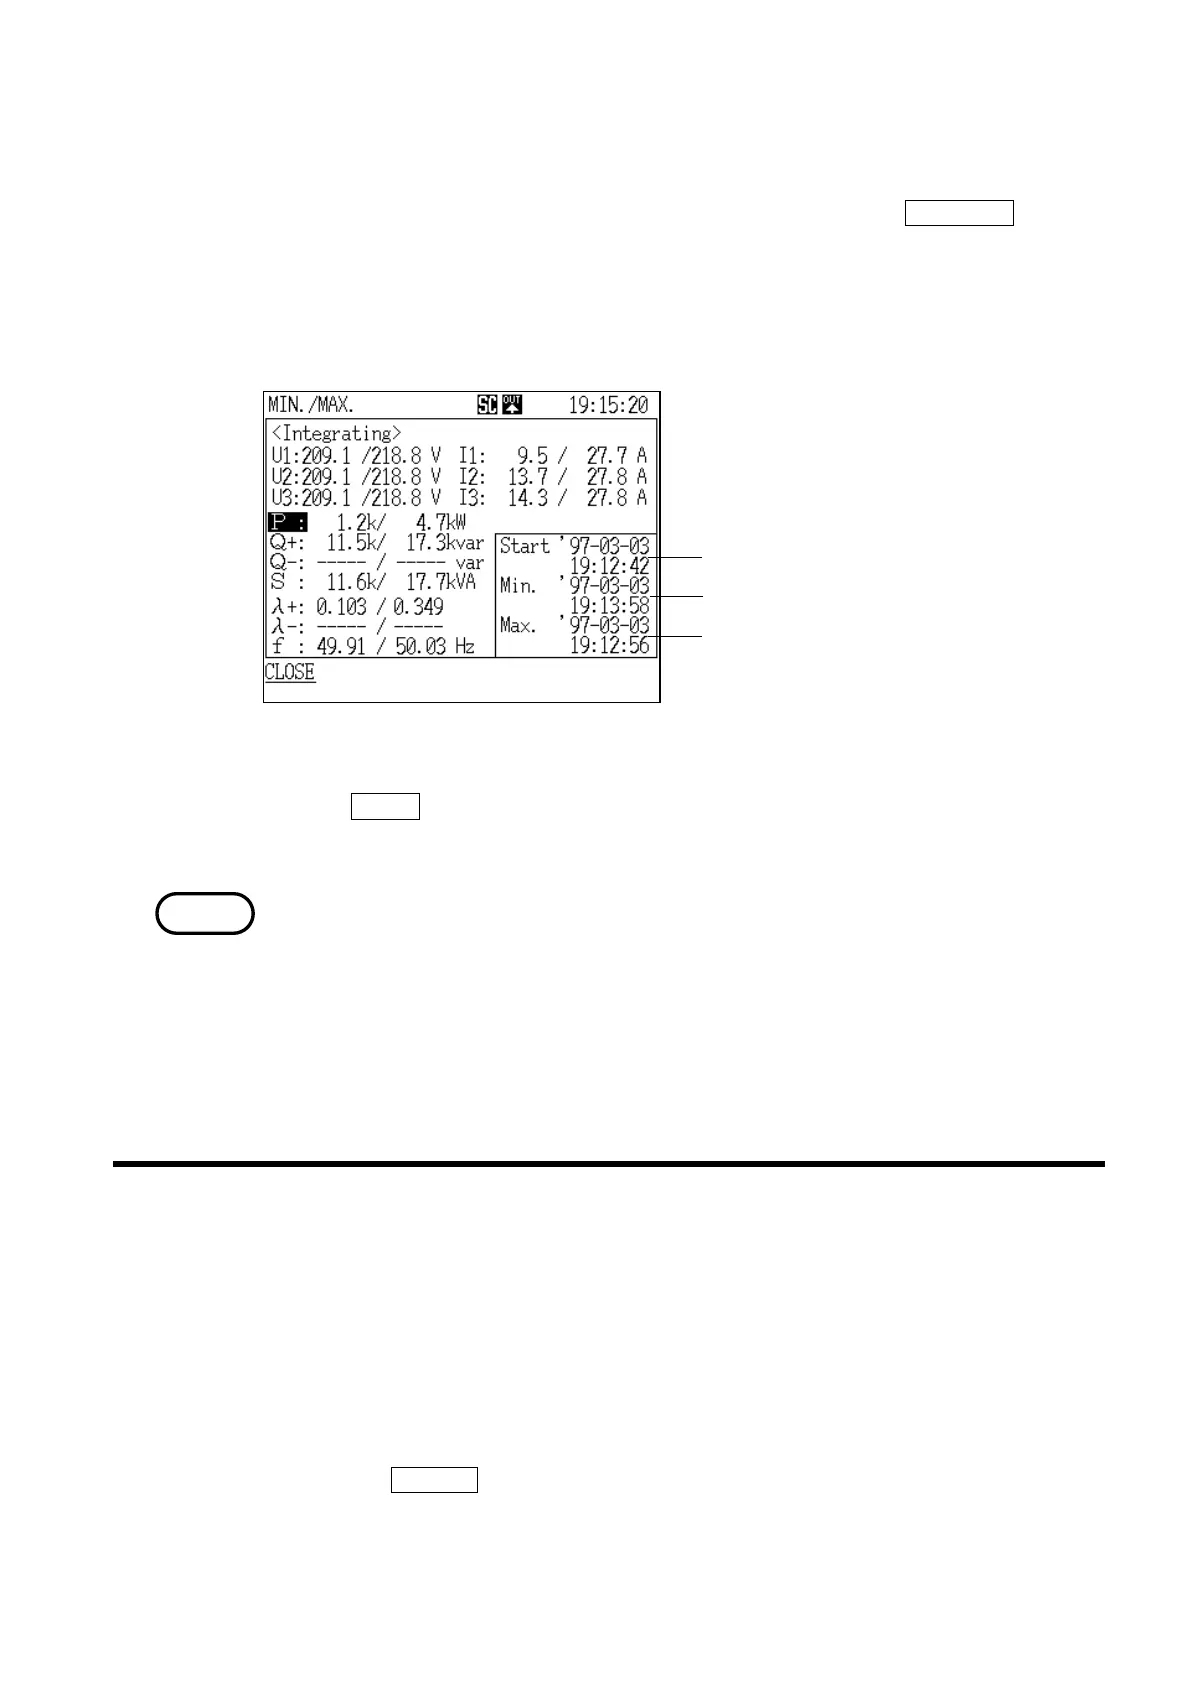
Data reset generation date and time
Minimum value generation date and time
Maximum value generation date and tim
Minimum/Maximum Value Generation Time Window
NOTE
.4.6 Displaying Integrated Values
●Displaying the time at which minimum and maximum values were
generated
1. With the "Minimum/Maximum" screen displayed, press the TIME OCCR function
key.
2. The "Generation Time" window is displayed.
3. Position the cursor on the measurement item for which you wish to see the
generation time.
4. The generation time is displayed for the item specified by the cursor.
5. If the
CLOSE function key is pressed, the "Generation Time" window closes
and the display returns to the "Minimum/Maximum"screen.
About "Over range"
"Over range" is defined to mean that the measured value exceeded 130% of
the voltage or current range, and is indicated by "o.r." (except minimum and
maximum values)
Although the over range indication is made when the measured power exceeds
130% of the rated range, if the voltage and current measurements both exceed
130% of their respective ranges but the power measurement does not, the
measured power value is displayed.
There are two integrated value display screens.
"Integration" screen page 1/2 displays measured values concerning power
consumption.
"Integration" screen page 2/2 displays measured values concerning power
flows, such as consumption/regeneration.
(1) Displaying the "Integration" screen (page 1/2)
1. Press the
SCR.KEY function key.
2. The "Display Selection" window appears.
3. Position the cursor at "Integration 1/2 (INTEG.1/2)."