104
────────────────────────────────────────────────────
7.4 Taking Measurements
────────────────────────────────────────────────────
NOTE
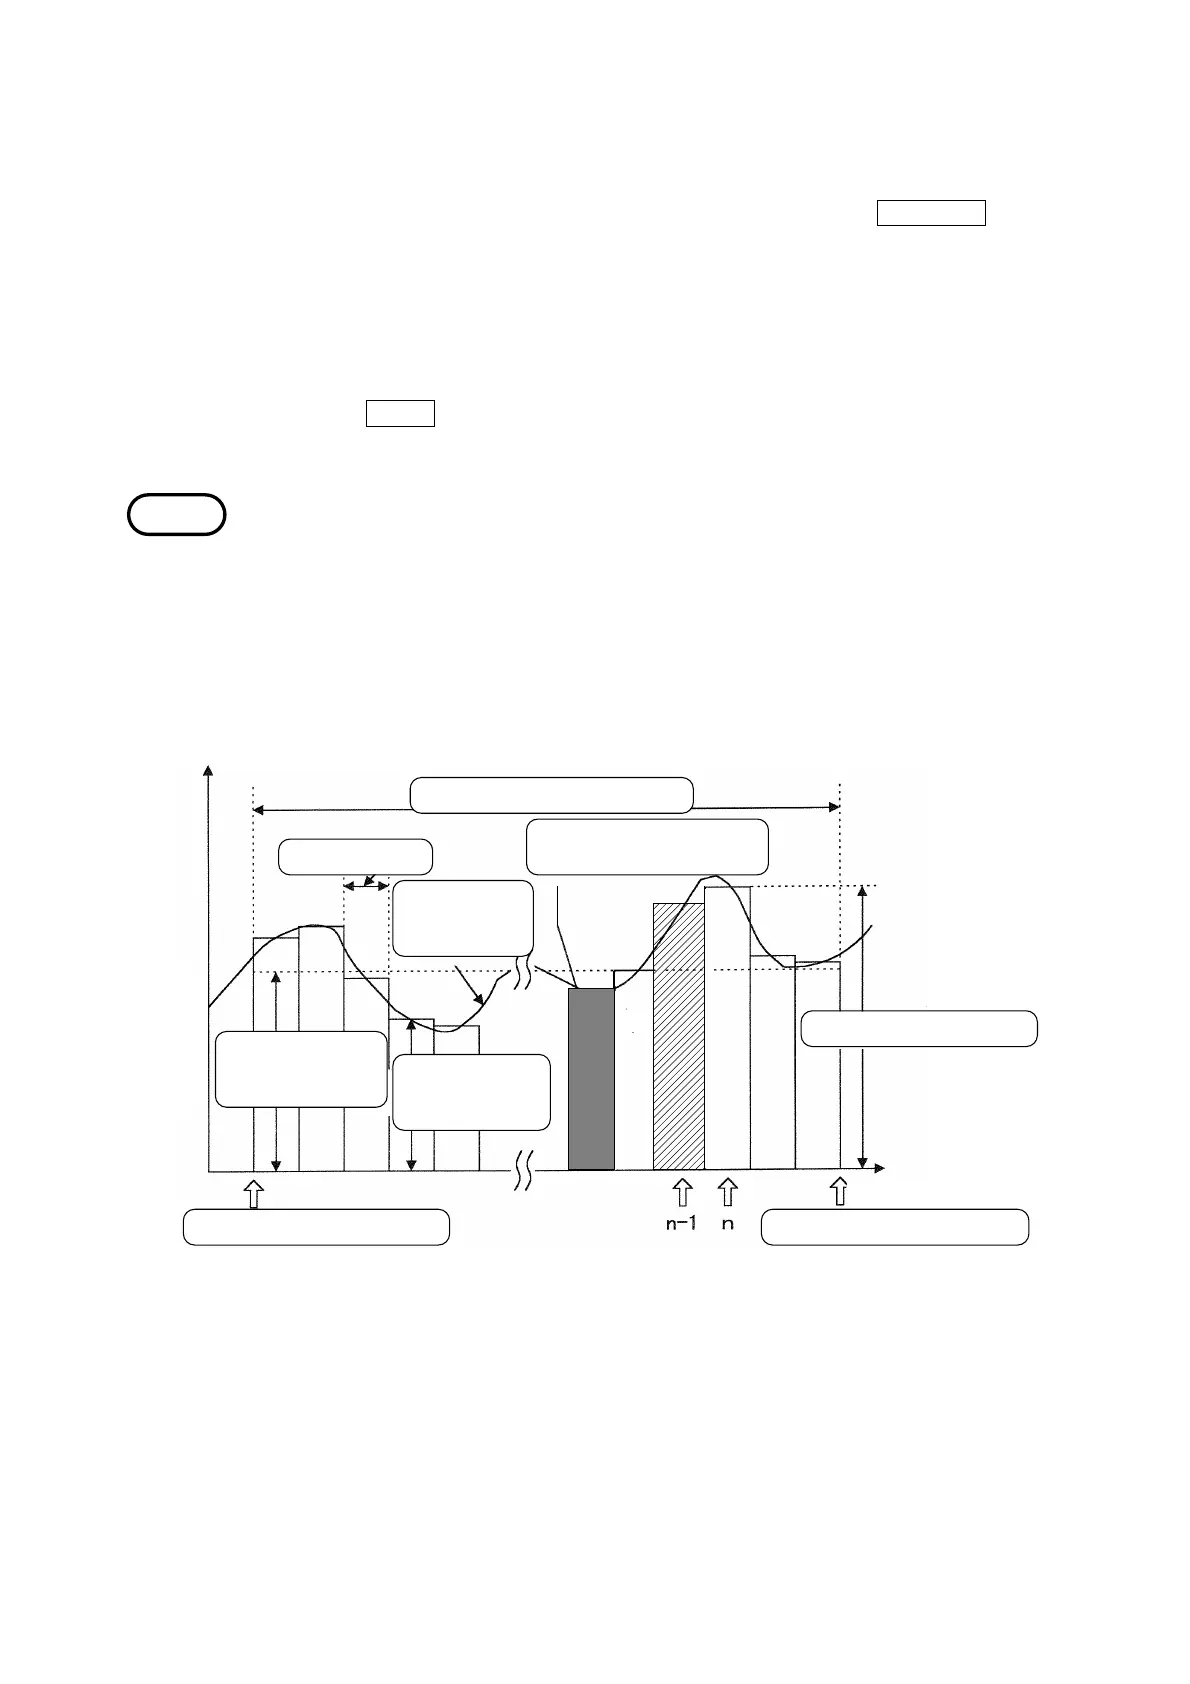
Power integration during
demand period
Instantaneous valu
Demand measurement perio
Demand perio
Average value
during
integration perio
Change in
instantaneou
value
Elapsed tim
Average value
during demand
period
Maximum demand valu
Demand measurement star
Demand measurement en
Display Values for Demand Measurement
●Displaying the time at which minimum and maximum values were
generated
1. With the "Minimum/Maximum" screen displayed, press the TIME OCCR function
key.
2. The "Generation Time" window is displayed.
3. Position the cursor on the measurement item for which you wish to see the
generation time.
4. The generation time is displayed for the item specified by the cursor.
When the
CLOSE function key is pressed, the "Generation Time" window closes
and the display returns to the "Minimum/Maximum" screen.
The relationship between the average value and the maximum demand value
within each period is shown in the following figure. Note that at the start of
demand measurement, a data reset is performed automatically.
Assuming time "n" as the present in the figure, the data "n-1" is displayed as
the demand value. In addition, the integrated data from the start of
measurement to the "present" is displayed as the integrated value.