116
────────────────────────────────────────────────────
7.5 Changing Settings
────────────────────────────────────────────────────
Demand
Power integration,
Average value within a time period
Integration
Power integration,
Average value within a time period
Maximum demand values
CAUTIO
In the case of demand measurement, the print/save item settings are made in
a special manner as described below.
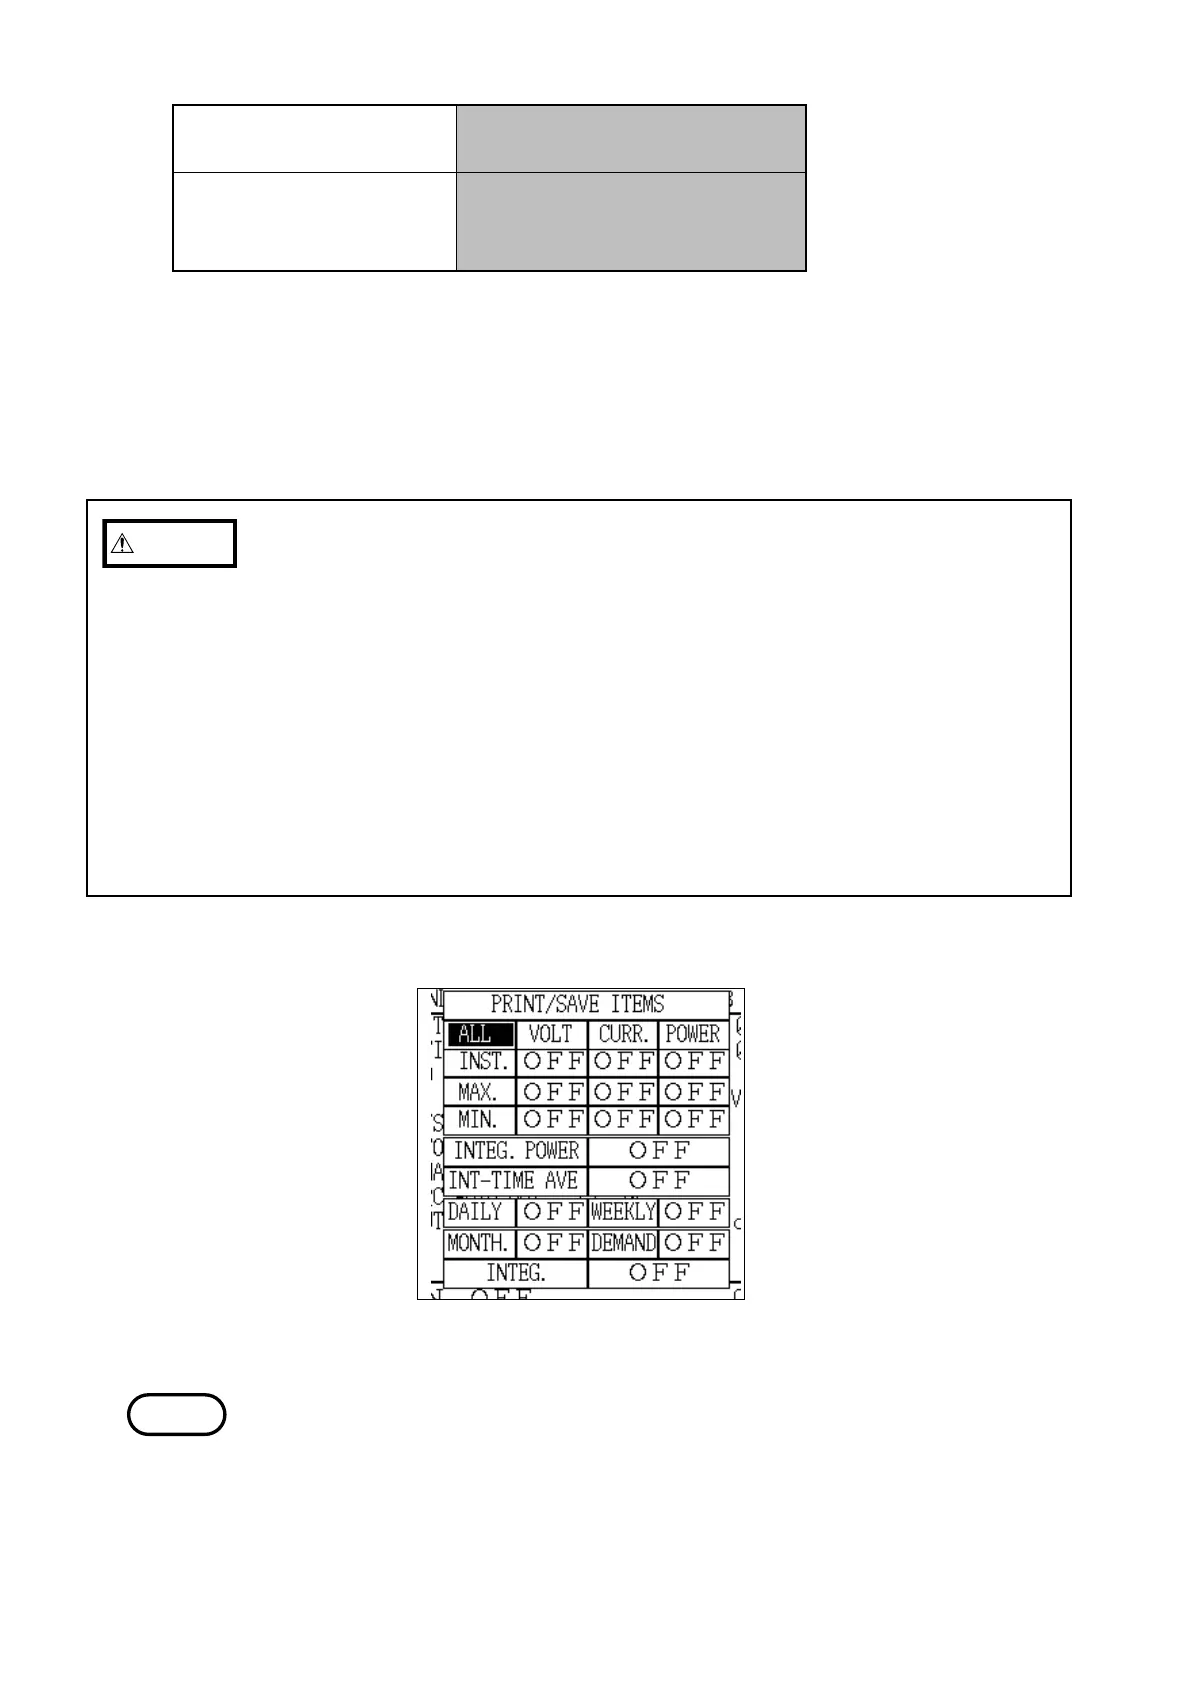
1) First, set to "ON" all of the necessary items from among daily report, weekly
report, monthly report, demand measurement and integrated measurement.
(Multiple items may be set.)
2) Next, set the items that are to actually be output from among the
instantaneous values, maximum values, minimum values, integrated power
levels, and average values over time; these items are set in common with
the items selected in step 1 above. (Multiple items may be set.)
3) In short, only the items selected in both step 1 (tabulation period) and step 2
(output items) are selected and valid initially. If only one setting is set to
"ON", nothing is output.
Print/Save Item Setting
NOTE
* Maximum demand values include the time at which the value was
generated.
* Regarding the above five items, the tabulated results for each measurement
period can also be output by coordinating the settings of the instantaneous
values, maximum values, minimum values, power integration, and the
average value within a time period.
・For details on the specific method for setting the print/save items, refer to
section 5.5.1, "Print/Save Items."
・The items set here are output in both manual operation or automatic
operation.
・The items that are output differ, depending on whether the integrated power
level is measured using the reactive power meter method or not.