APPENDIX 33
────────────────────────────────────────────────────
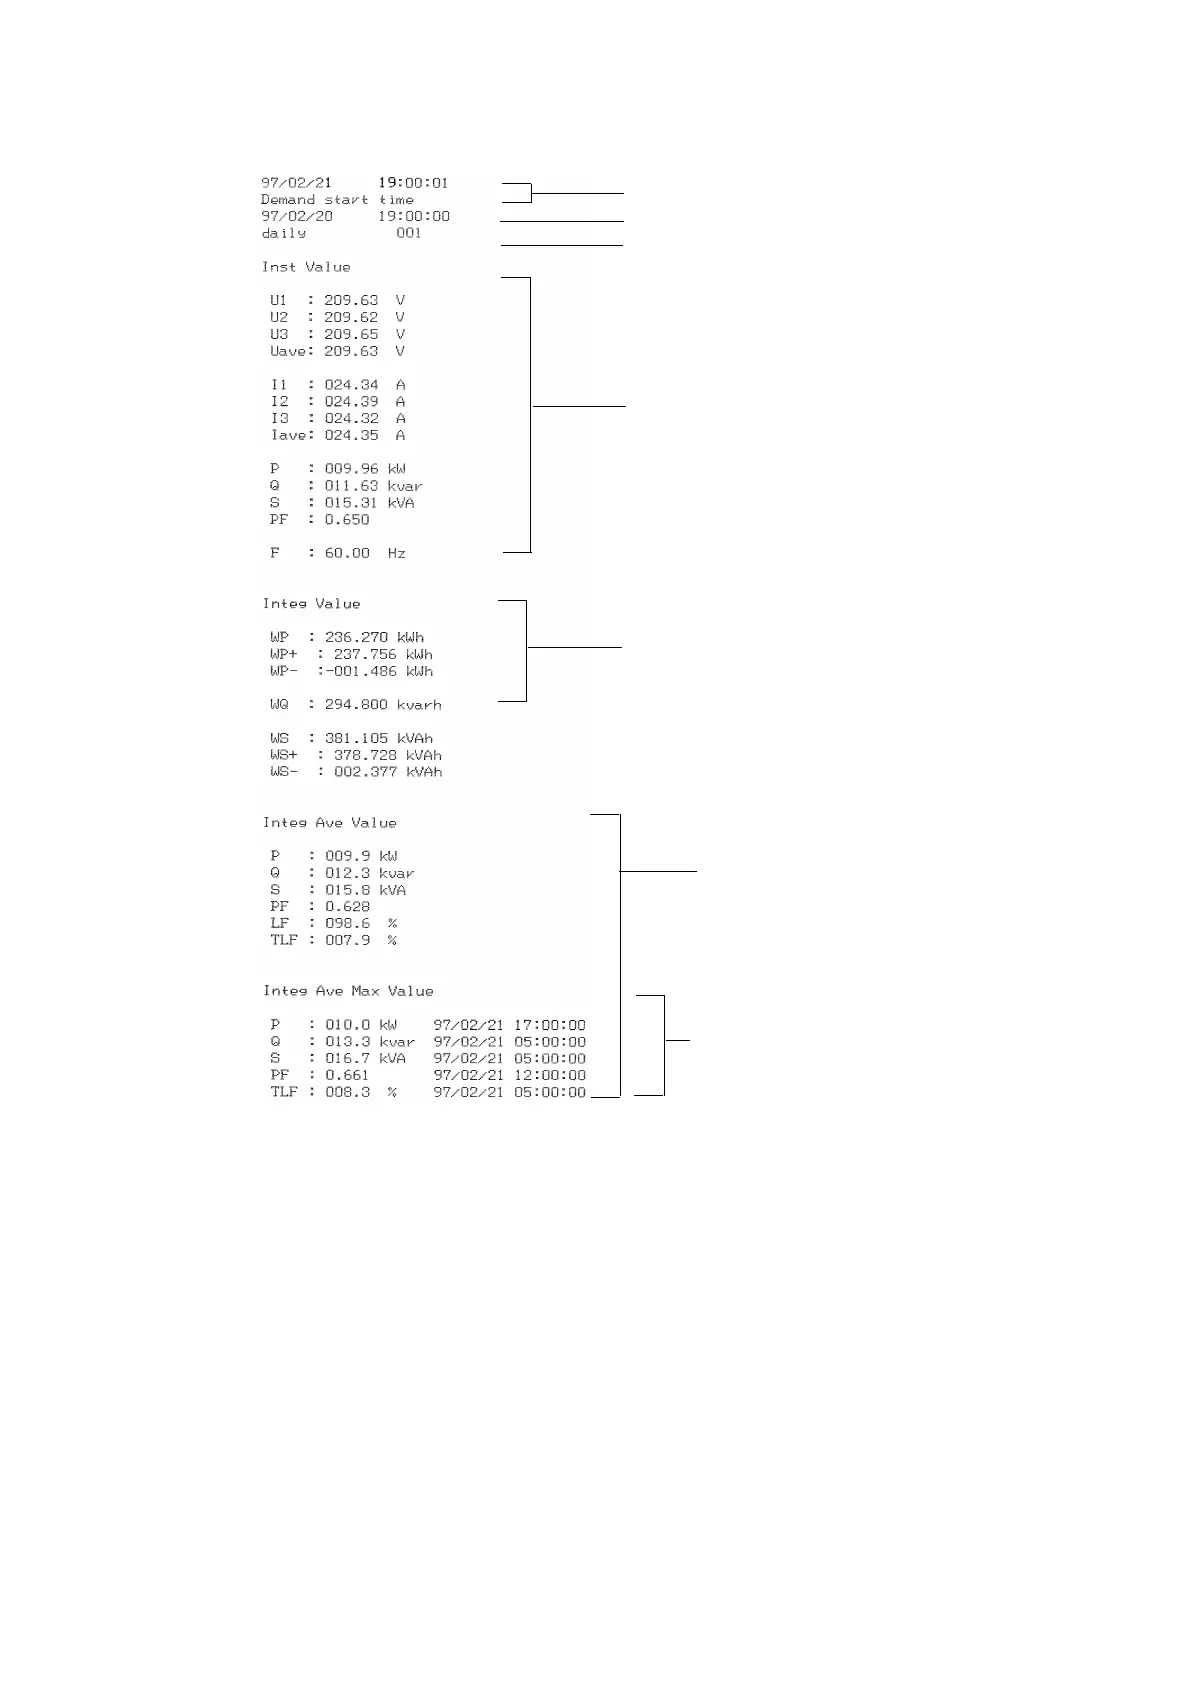
Appendix 8 Printout Samples
────────────────────────────────────────────────────
Date and time of printou
Date and time of start of demand measuremen
Daily report output count
* This example shows the data for the firs
daily report.
Instantaneous values at the time of printin
(voltage, current, and power)
Integrated power
* These are the total integrated values,
from the start of demand measurement unt
the end (one day).
Maximum demand values and the
date and time at which they occurred
* In the case of integrated measurement,
daily reports, weekly reports, and
monthly reports, the maximum demand
value generated during that period is
output here, along with the date and tim
at which that maximum was generated.
Average value within a time period
* These are the average values
during the one-day period, derived
from the integrated power indicate
above.
Daily report (Instantaneous value, integrated power, and average value within
a time period)