R&S
®
ZVA / R&S
®
ZVB / R&S
®
ZVT GUI Reference
Trace Menu
Operating Manual 1145.1084.12 – 30 181
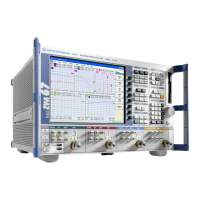
Definition of statistical quantities
The statistical quantities are calculated from all response values in the selected evaluation range.
Suppose that the trace in the evaluation range contains n stimulus values x
i
and n corresponding
response values y
i
(measurement points).
Min. and Max. are the largest and the smallest of all response values y
i
.
Pk-Pk is the peak-to-peak value and is equal to the difference Max. – Min.
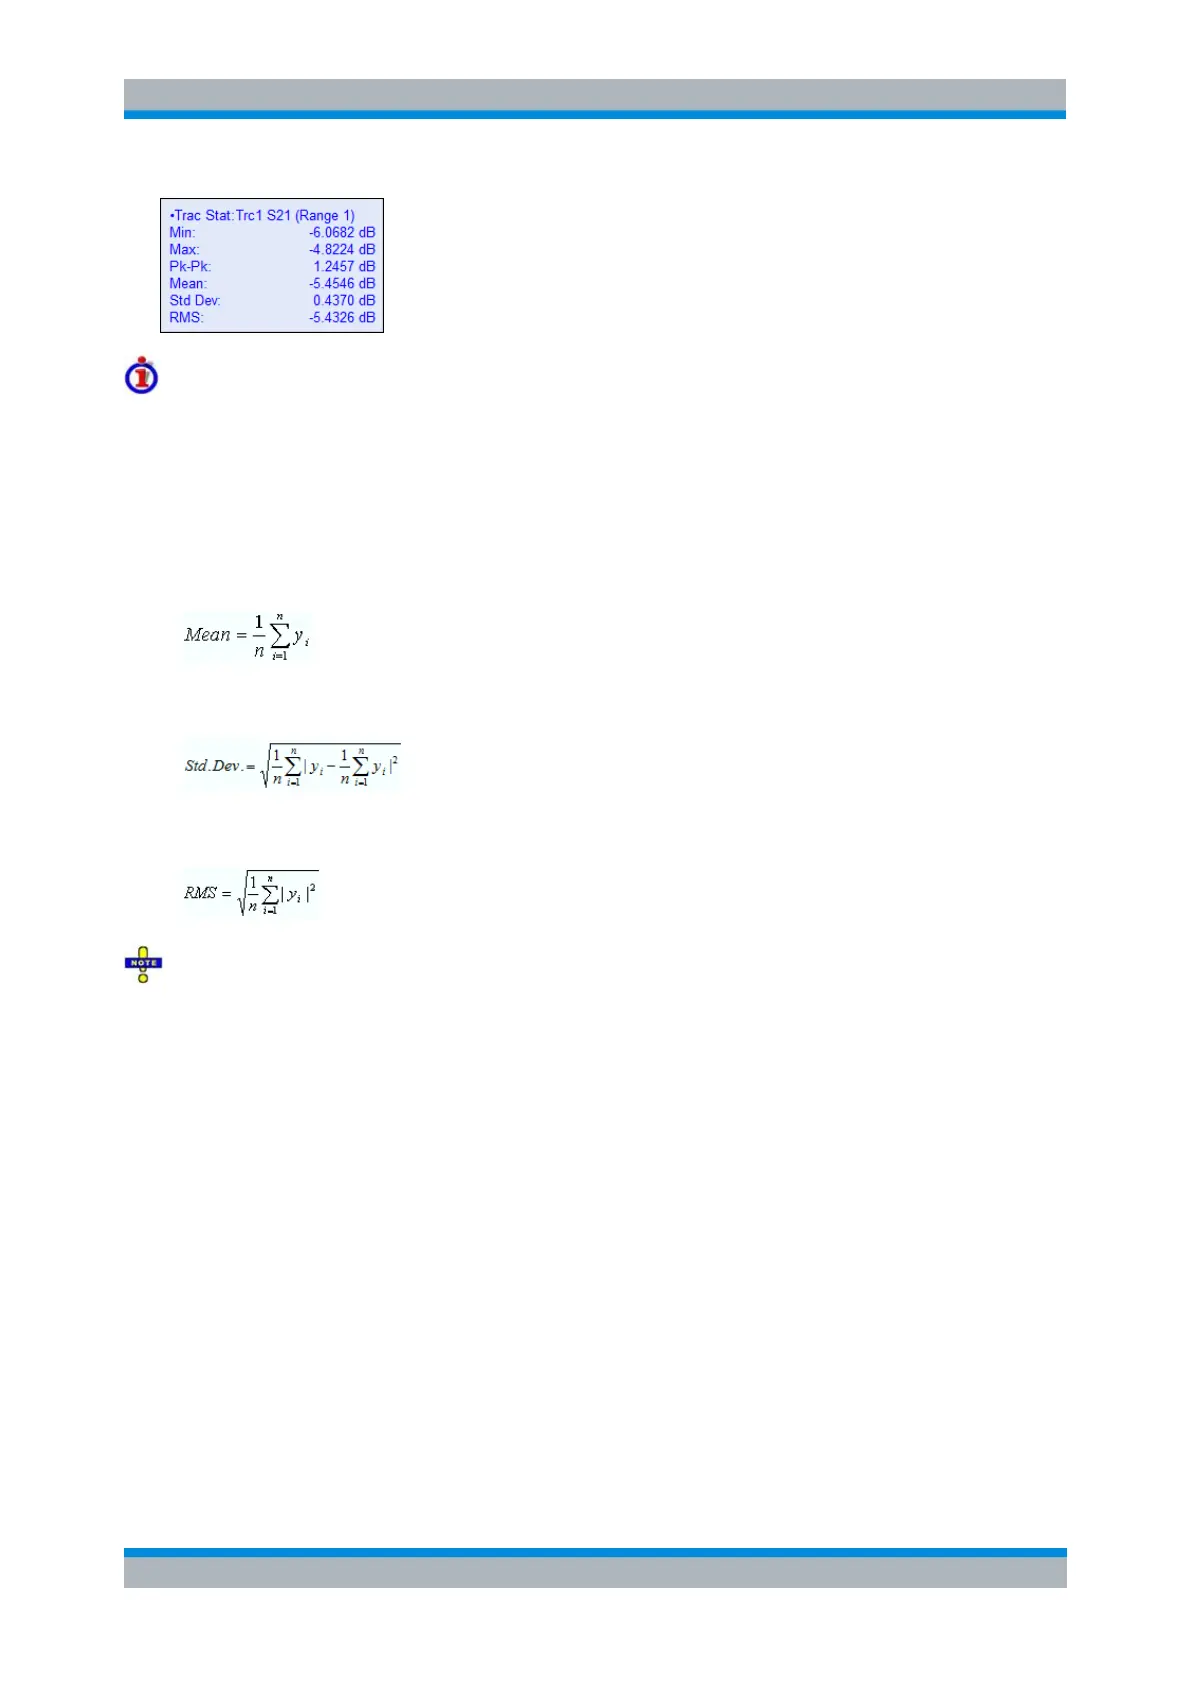
Mean is the arithmetic mean value of all response values:
SDev is the standard deviation of all response values:
RMS is the root mean square (effective value) of all response values (real number!):
To calculate the Min., Max., Pk-Pk, Mean and SDev values, the analyzer uses formatted response
values y
i
(see trace formats). Consequently, the mean value and the standard deviation of a trace depend
on the selected trace format.
In contrast, the RMS calculation is based on linear, unformatted complex values and is then converted
according to the trace format. Since the RMS value is a real number by definition, its phase and imaginary
part are always zero. To prevent misunderstandings, the RMS result of the Phase, Delay, Imag, and
Unwrapped Phase traces is therefore displayed as "RMS: -----".
CALCulate<Chn>:STATistics[:STATe]
CALCulate<Chn>:STATistics:RESult? MIN | MAX | PEAK2P | MEAN |
STDDev | RMS
CALCulate<Chn>:STATistics:MMPTpeak[:STATe]
CALCulate<Chn>:STATistics:MSTDev[:STATe]
CALCulate<Chn>:STATistics:RMS[:STATe]
El. Length/Phase Delay
Displays or hides the phase delay (Phs Dly) and the electrical length (El Len) of the trace in the selected
evaluation range (Eval Range...). The parameters are only available for trace formats that contain phase
information, i.e. for the formats Phase, Unwrapped Phase, and the polar diagram formats Polar, Smith,
Inverted Smith. Moreover, the sweep type must be a frequency sweep.