R&S
®
ZVA / R&S
®
ZVB / R&S
®
ZVT GUI Reference
Trace Menu
Operating Manual 1145.1084.12 – 30 180
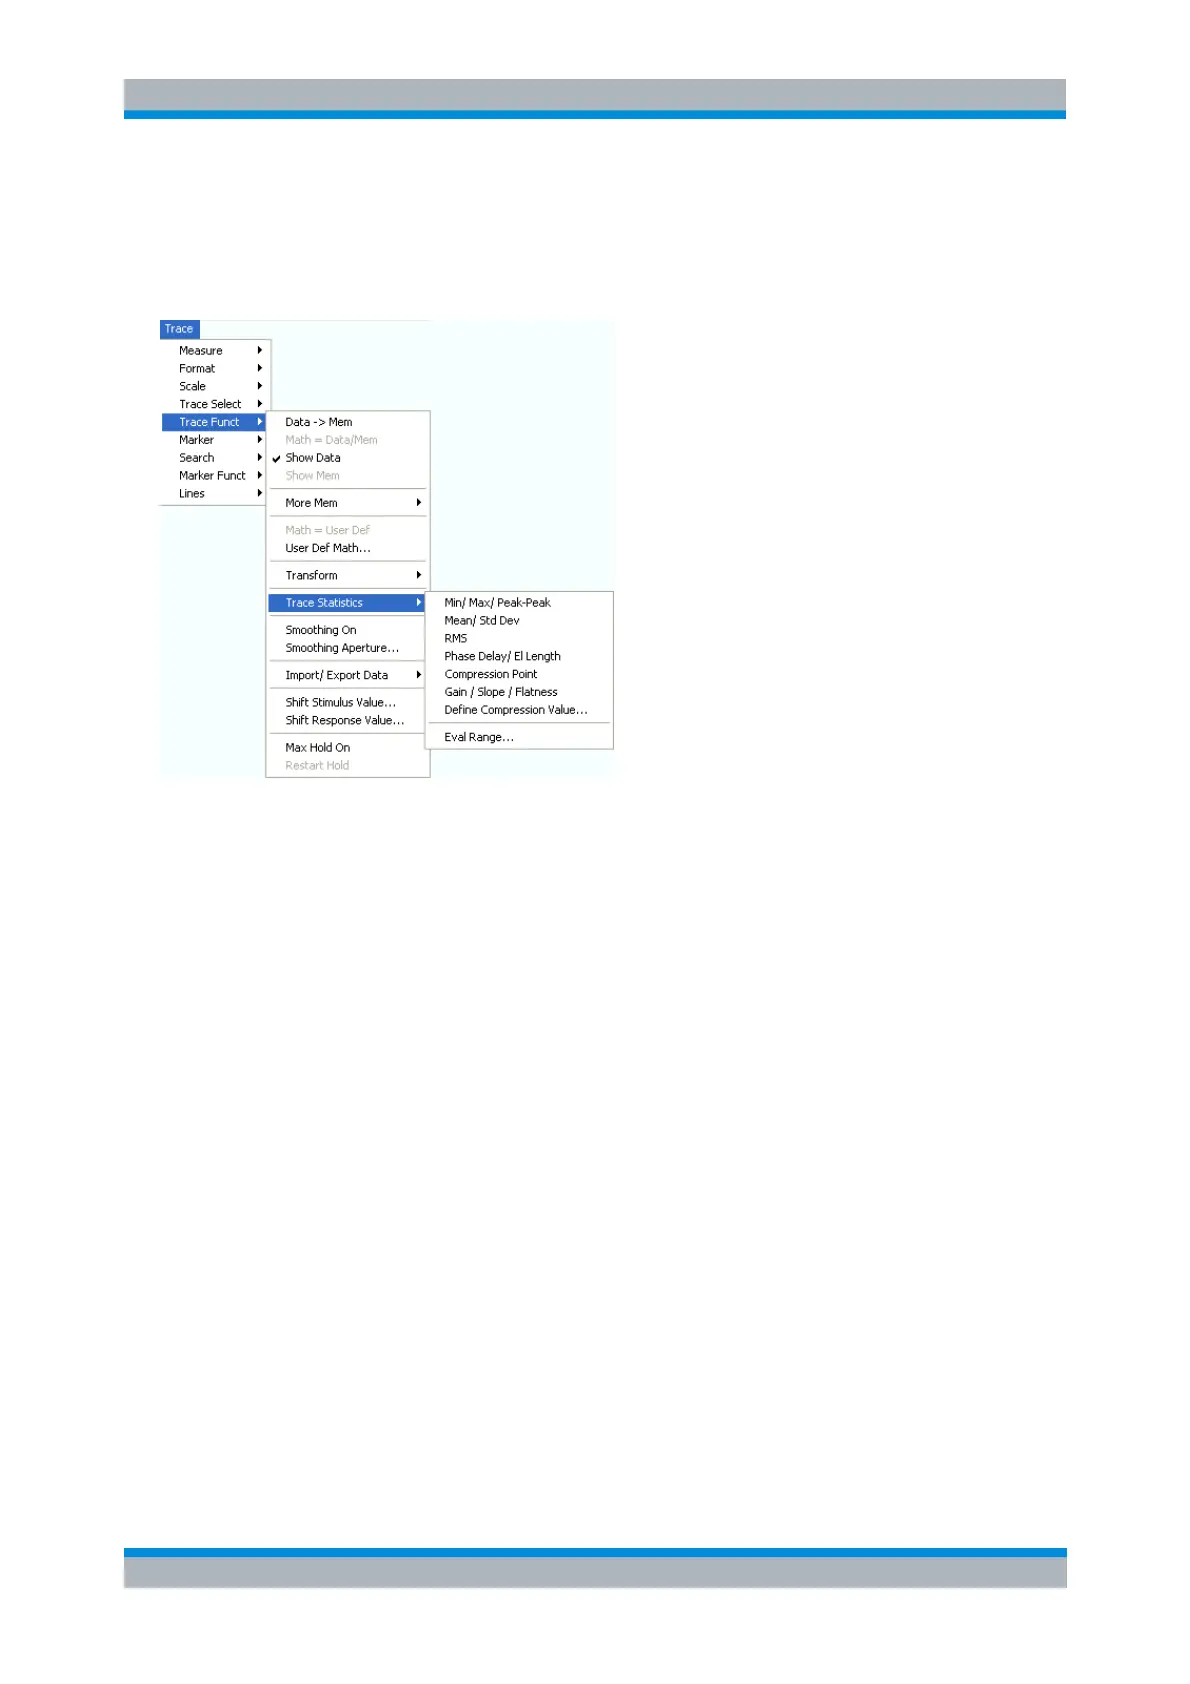
Trace Statistics
Opens a submenu to evaluate and display statistical and phase information of the entire trace or of a
specific evaluation range and calculate the x-dB compression point.
Min/Max/Peak-Peak displays or hides the essential statistical parameters of the trace in the
selected evaluation range.
Mean/Std Dev displays or hides the arithmetic mean value and the standard deviation of the trace
in the selected evaluation range.
RMS displays or hides the RMS value of the trace in the selected evaluation range.
Phase Delay/El Length displays or hides the phase delay and the electrical length of the trace in
the selected evaluation range (Eval Range...).
Compression Point starts the x-dB compression point evaluation
Define Compression Value... sets the compression level (x dB).
Gain/Slope/Flatness displays or hides trace parameters for the current evaluation range.
Eval Range... opens a dialog to define the range for the statistical and phase evaluation and for
the compression point measurement.
Statistical Evaluation
The first three commands in the Trace Statistics submenu display or hide the maximum (Max.), minimum
(Min.), the peak-to-peak value (Pk-Pk), arithmetic mean value (Mean), the standard deviation (Std. Dev.),
and the RMS value of all response values of the trace in the selected evaluation range (Eval Range...).