R&S
®
ZVA / R&S
®
ZVB / R&S
®
ZVT GUI Reference
Trace Menu
Operating Manual 1145.1084.12 – 30 184
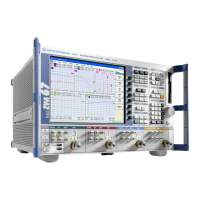
Suppose that A and B denote the trace points at the beginning and at the end of the evaluation range,
respectively.
Gain is the larger of the two stimulus values of points A and B.
Slope is the difference of the stimulus values of point B minus point A.
Flatness is a measure of the deviation of the trace in the evaluation range from linearity. The
analyzer calculates the difference trace between the active trace and the straight line between
points A and B. The flatness is the difference between the largest and the smallest response
value of this difference trace.
CALCulate<Chn>:STATistics:SFLatness[:STATe]
CALCulate<Chn>:STATistics:RESult? GAIN | SLOPe | FLATness
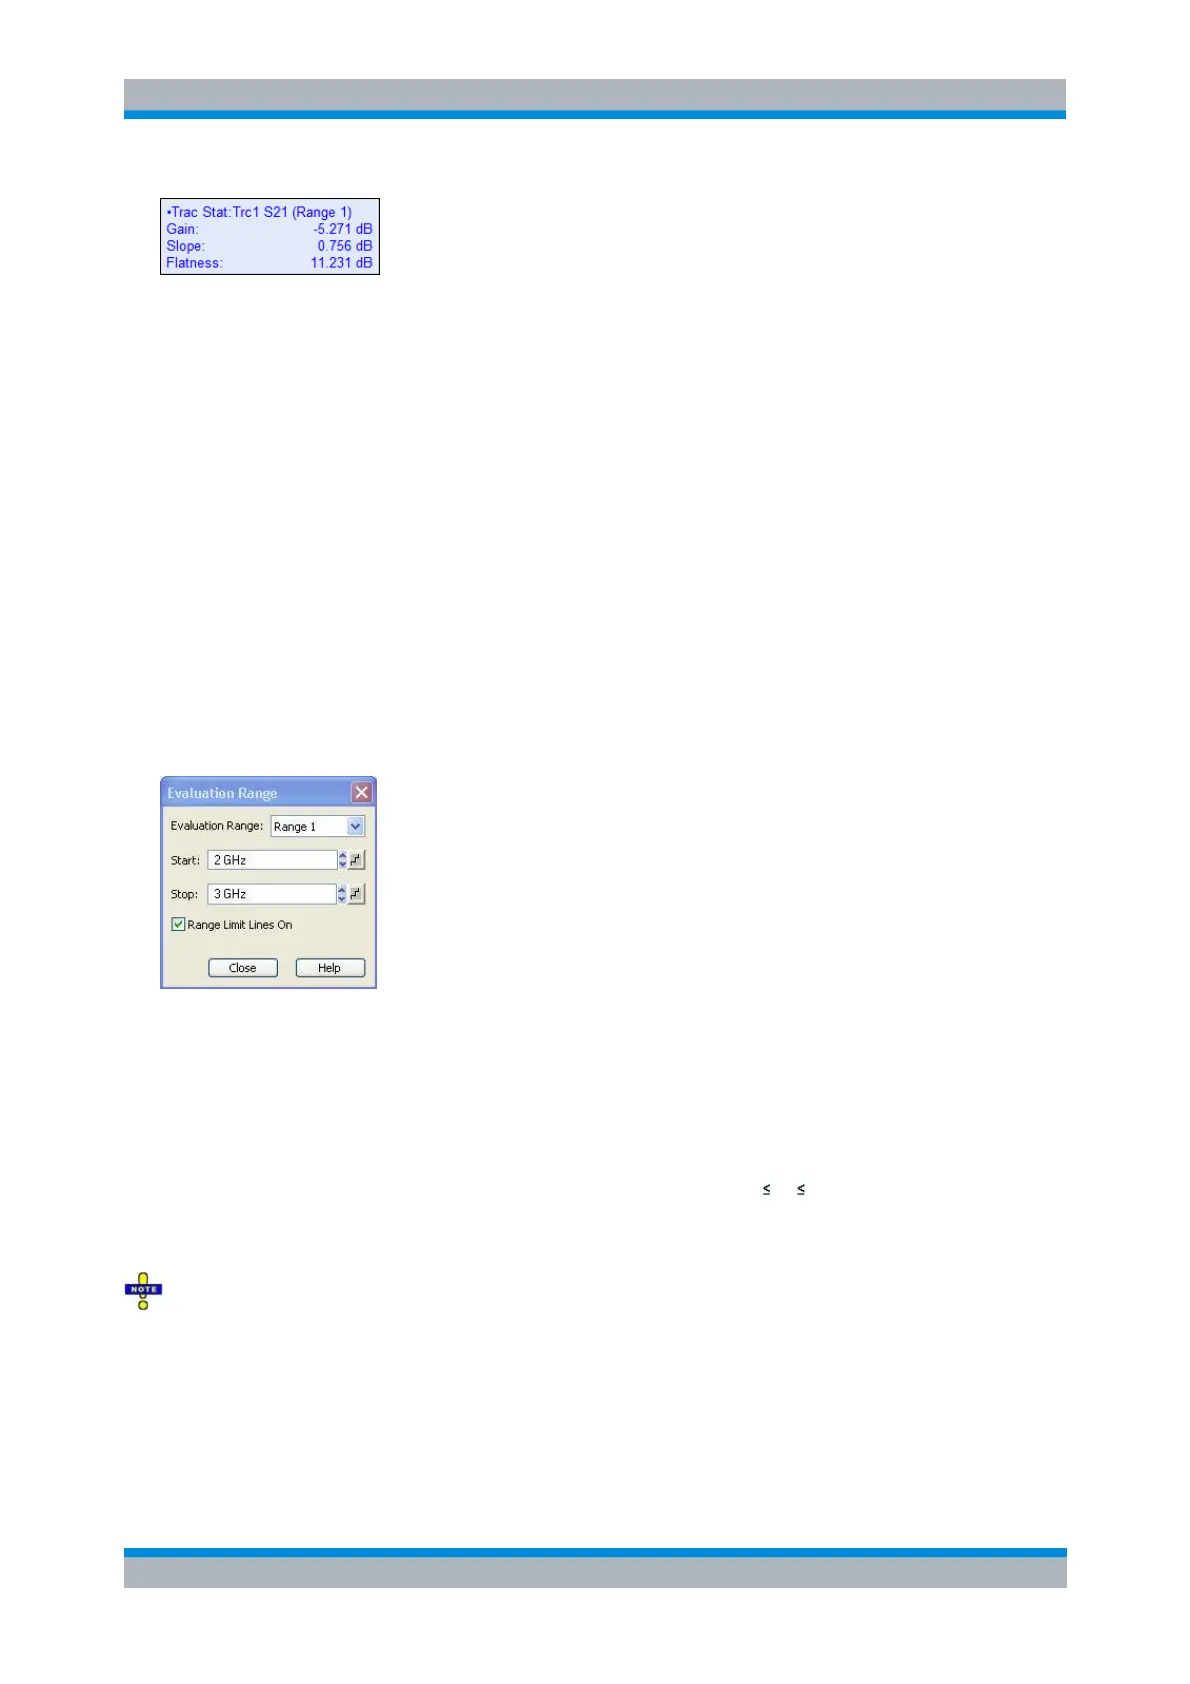
Eval Range
Opens a dialog that allows to define the evaluation range for the trace statistics functions. The evaluation
range is a continuous interval of the sweep variable.
To restrict the evaluation range select one of the user-defineable ranges 1 to 10 and use the Start and
Stop input fields to modify the selected range. The selected range is assigned to the active trace.
Evaluation Range Selects the range confining the evaluation range of the active trace's statistics
functions and makes it the active display range of the related channel.
Start/Stop defines the lower/upper limit of the selected range.
The trace statistics functions take into account all measurement points with stimulus values x
between the Start and Stop value of the evaluation range: Start x Stop.
Range Limit Lines On If enabled, the Start and Stop of the channel's active display range are
displayed as vertical lines whenever this channel becomes the active one.
The Start and Stop settings affect all search ranges and evaluation ranges that are defined using this
range.
CALCulate<Chn>:STATistics:DOMain:USER <numeric_value>
CALCulate<Chn>:STATistics:DOMain:USER:STARt <numeric_value>
CALCulate<Chn>:STATistics:DOMain:USER:STOP <numeric_value>
CALCulate<Chn>:STATistics:DOMain:USER:SHOW