R&S
®
ZVA / R&S
®
ZVB / R&S
®
ZVT System Overview
Screen Elements
Operating Manual 1145.1084.12 – 30 29
The trace type of each trace in a diagram area is indicated in the trace list. You can also make each
trace Invisible without deleting it.
Trace List and Trace Settings
The main properties of all traces assigned to the diagram area are displayed in the trace list in the upper
left corner.
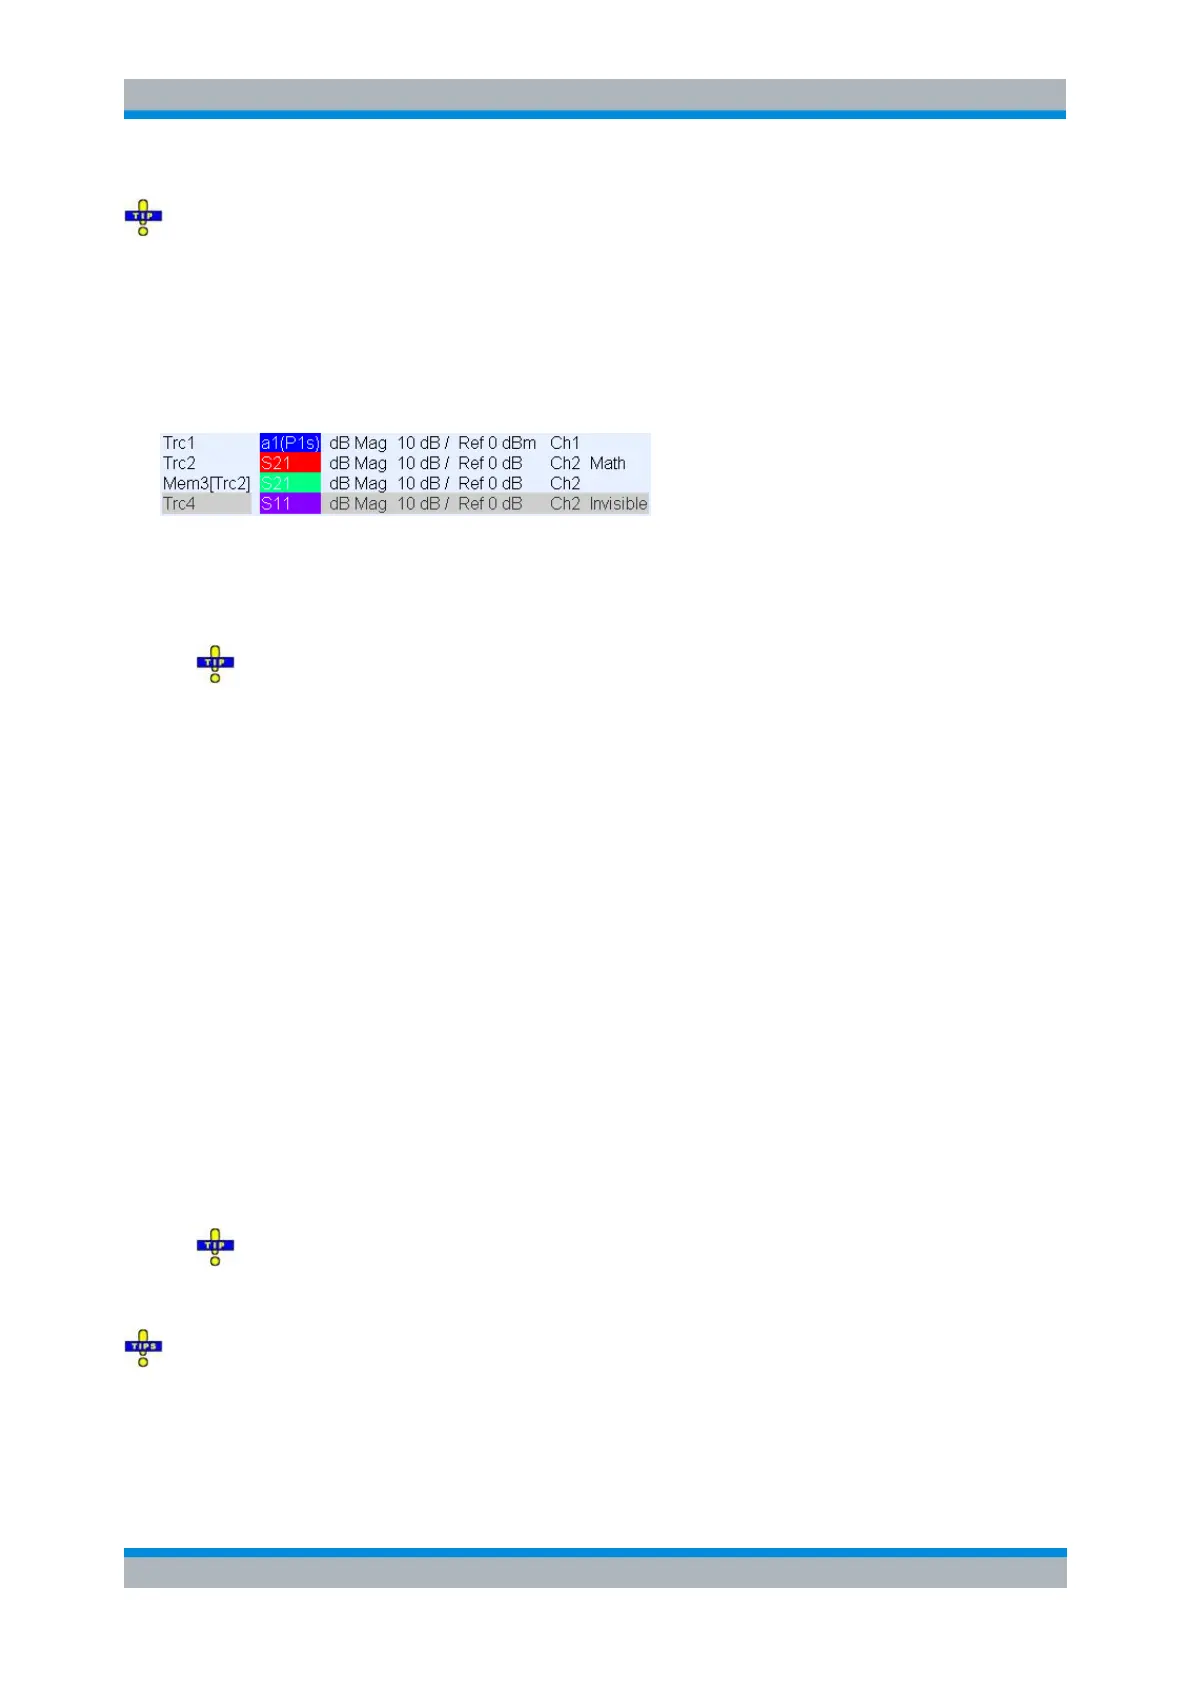
Each line in the trace list describes a single trace. The active trace is highlighted. The lines are divided
into several sections with the following information (from left to right):
Trace name indicates the current trace name. The default names for new traces are Trc<n>
where <n> is a current number. A Mem... preceding the trace name indicates a memory trace.
Right-click the section and call the Trace Manager from the context menu to change the trace
name.
Measured quantity indicates the measurement result, e.g. an S-parameter or a ratio. The
measured quantity of the active trace is also displayed in the diagram area below the trace list.
For wave quantities and ratios, the drive port appears in brackets behind the measurement result.
Examples: b2/a1(P1s) denotes the ratio b2/a1 with the analyzer port no. 1 as a drive port; b2(G1s)
denotes the wave quantity b2 with the external generator no. 1 as a drive port. In true differential
mode, bd2(Pd1s) denotes the differential mode wave quantity b2 with the analyzer port no. 1 as a
drive port, providing a differential mode stimulus signal.
Detector : If an AVG, RMS, or Peak (Pk) detector is active, the detector setting appears behind
the measured quantity. The AVG detector is available for S-parameters, ratios, and wave
quantities. The other detectors are available for ratios and wave quantities. See section Detector.
Format shows how the measured data is presented in the graphical display (trace format).
Scale shows the value of the vertical or radial diagram divisions (Scale Div.) and the Reference
Value.
Channel shows the channel that each trace is assigned to. The channel section is omitted if the
all traces in the diagram area are assigned to the same channel.
Type is Invisible if the trace is hidden. Otherwise it indicates
- Math, if the trace is a mathematical trace,
- GAT, if a time gate is active for the trace and
- ALC, if the drive port is under automatic level control.
Right-click the trace name and click Show Data or Show Mem from the context menu to
display and hide data and memory traces. Use the Trace Funct(ions) to define mathematical
traces.
The trace list is compressed if the diagram space is limited. The complete trace line of the active trace
is also displayed in the status bar below the diagram area.
Right-click any of the sections in the trace list (except Type) to open a context menu and access the most
common tasks related to the section.