62
2.
Touch EDIT, then select “New Chart.”
When you create a chart, the cells
immendiately above or left of the selection
(if any) contain labels for one of the axes in
your chart. (See “Exchanging the X and Y
axes” later in this chapter.)
Formatting a chart
The default chart display is a column chart. You can
display the same data in a pie chart, line chart, or stack
chart. In addition you can add a chart title, add gridlines,
remove the chart legend and reverse the chart axes.
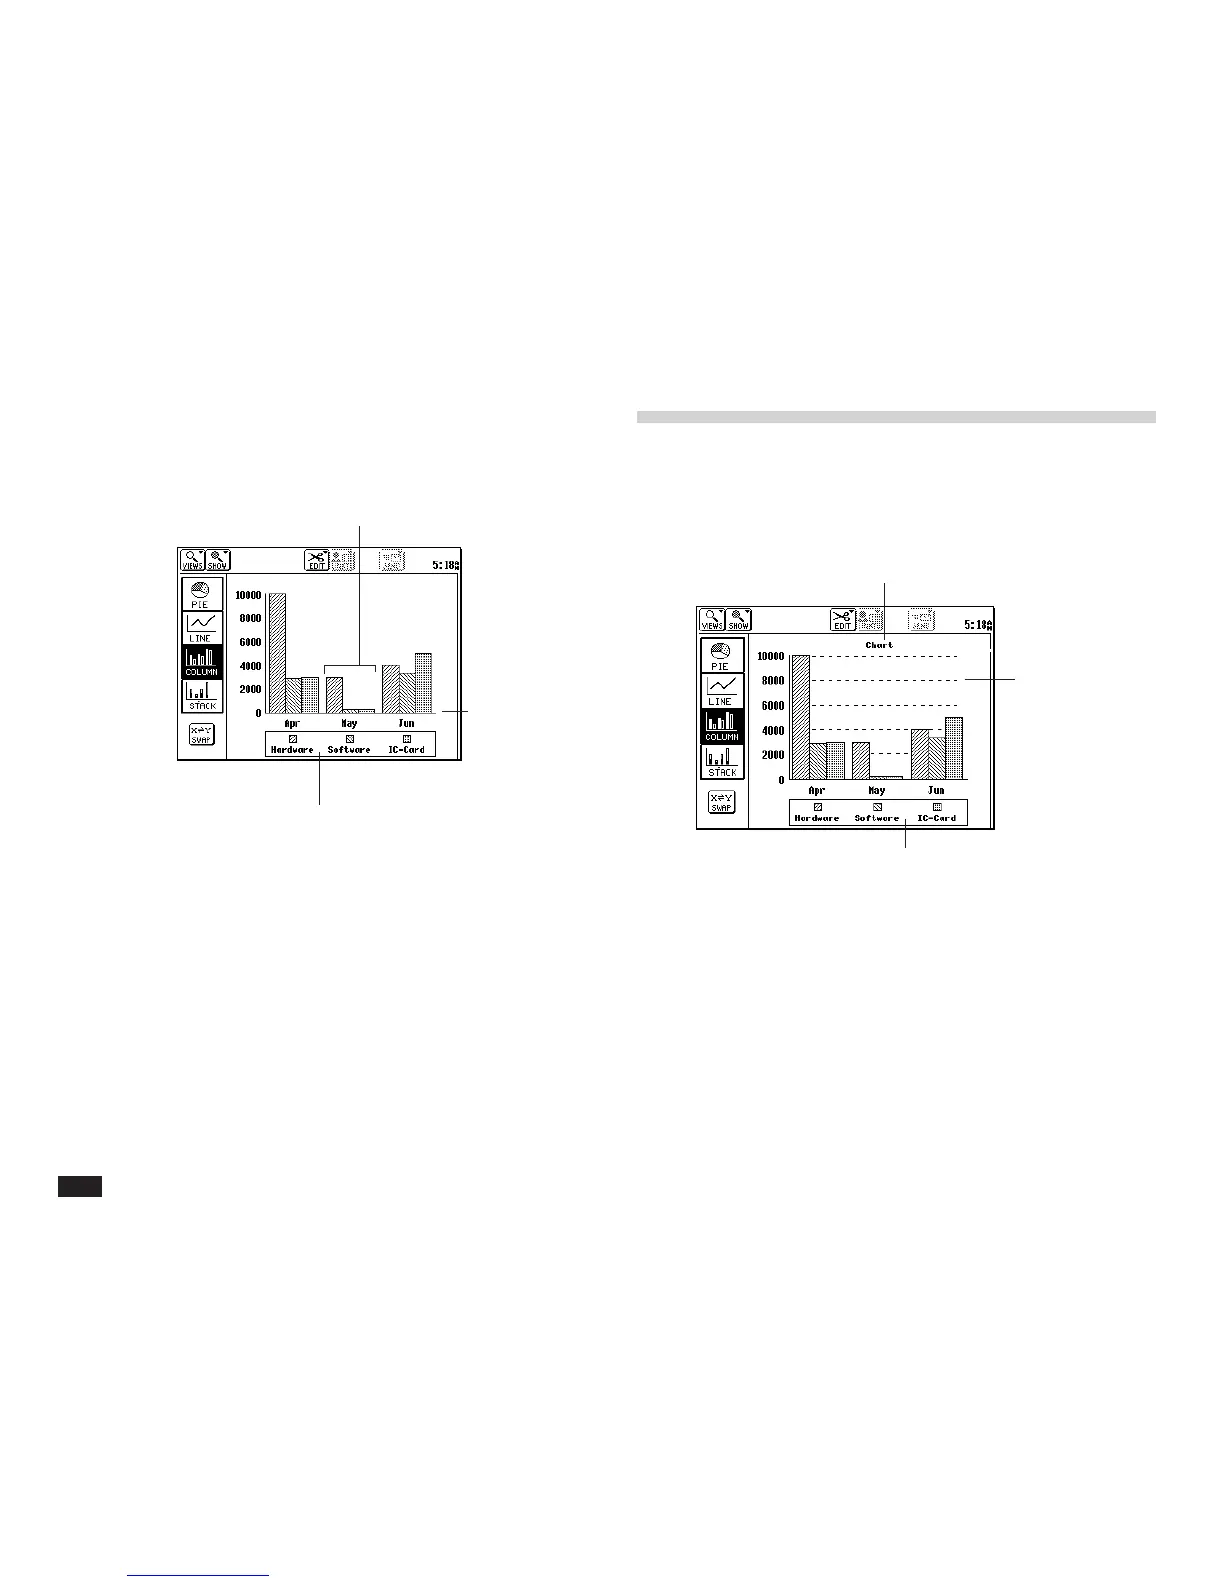
To change the chart format, touch PIE, LINE, COLUMN,
or STACK.
The number of bars comes from the
number of rows in the selected range.
The horizontal (X)
axis labels come
from the row
above the
selected range.
The chart legend comes from the
column to the left of the selected range.
Chart title
Grid lines
Legend