63
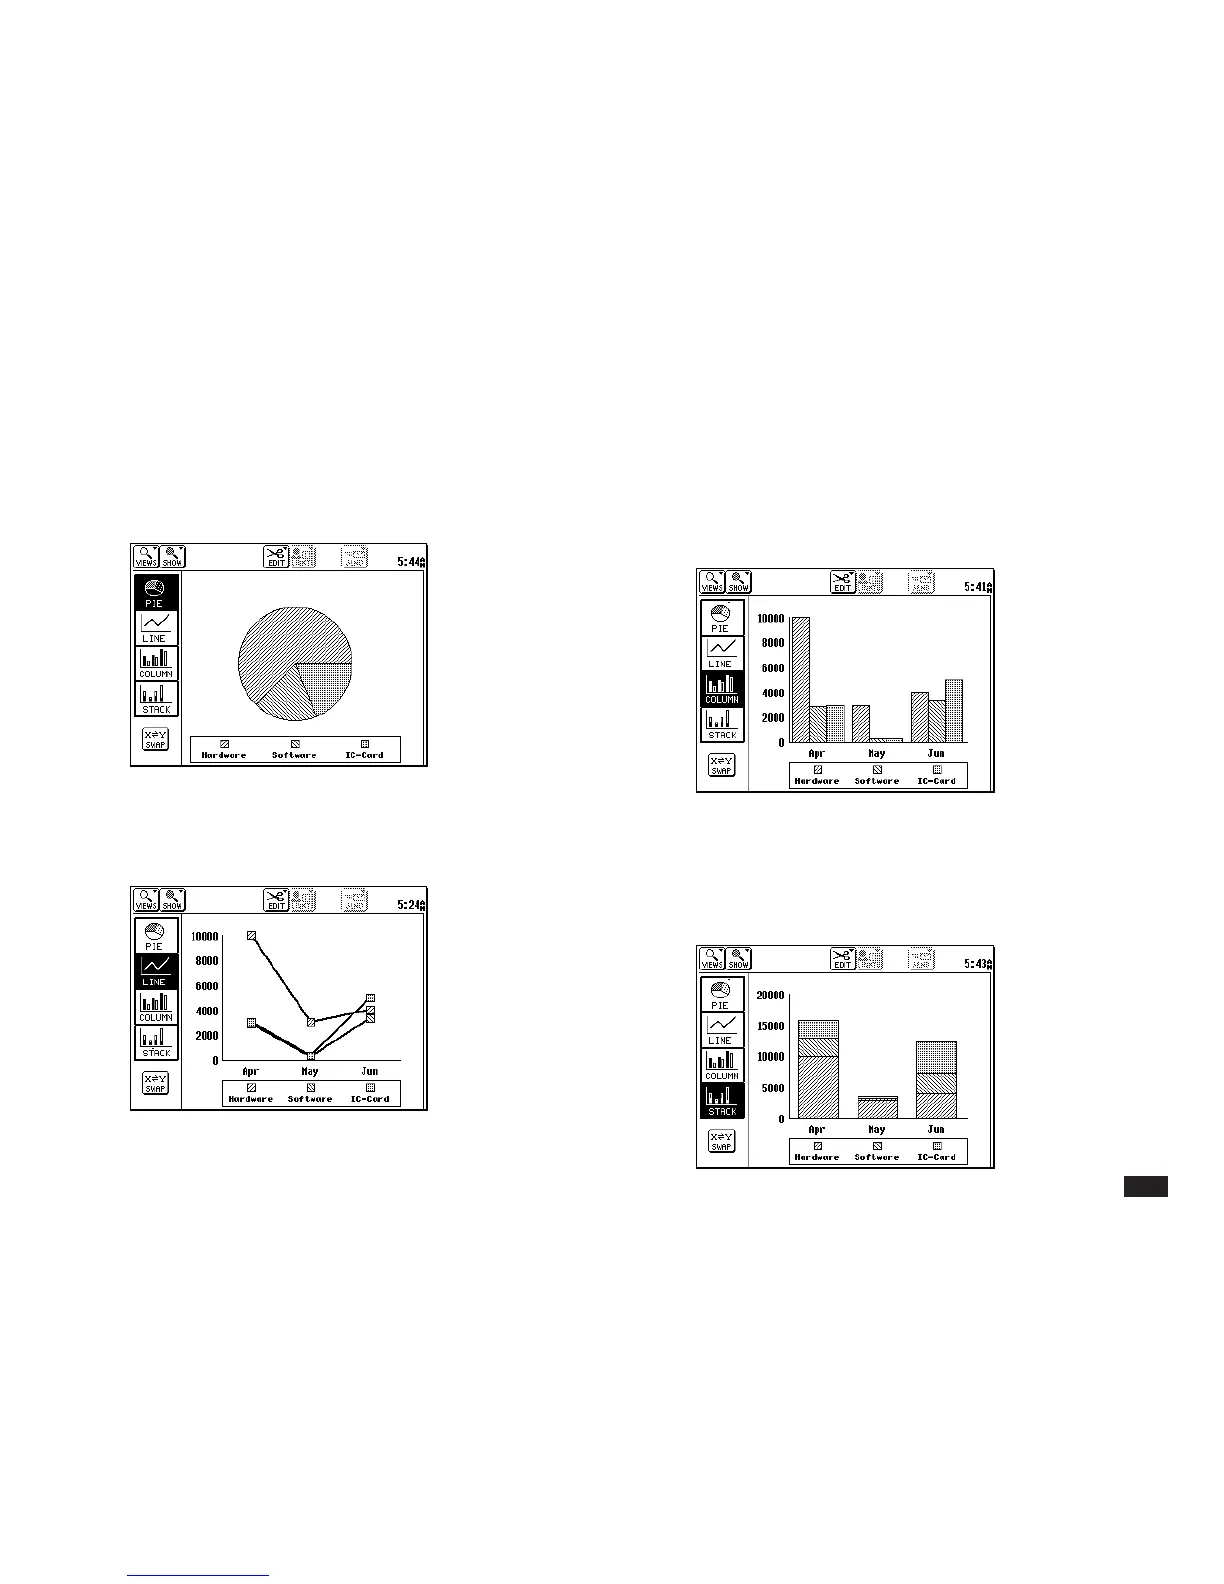
Pie charts
A pie chart shows the data from one column in the
selected range as percentages of a whole.
Line charts
A line chart shows the individual values of selected data
connected by a line.
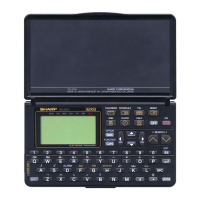
Column charts
A column chart displays all the data for each row or
column in the worksheet as a single column, with each
category of data distinguished by its pattern.
Stacked column charts
A stacked column chart displays all the data for each
row or column in the selected range as a single column,
with each category of data distinguished by its pattern.